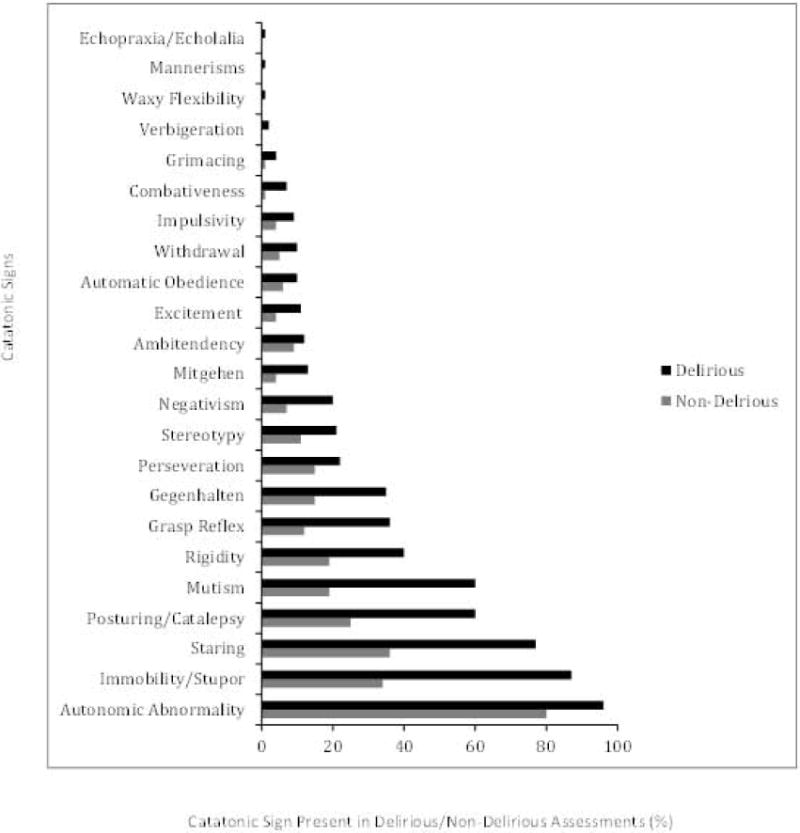
Figure 2. Frequency and Distribution of Catatonic Signs According to Delirium Status.

Percent of catatonic signs that were present in delirious (CAM-ICU +) versus non-delirious (CAM-ICU −) assessments (N=452, all paired assessments rather than by patient). Note that for each catatonic sign shown on the Y axis, the frequency is higher in delirious than in non-delirious patients, demonstrating overlap of individual catatonic signs and delirium in critically ill patients. †Delirium diagnosed using CAM-ICU: Confusion Assessment Method for the ICU.
‡ Catatonic signs were measured using the Bush Francis Catatonia Rating Scale.
† Delirium was diagnosed with the CAM-ICU: Confusion Assessment Method for the ICU.
