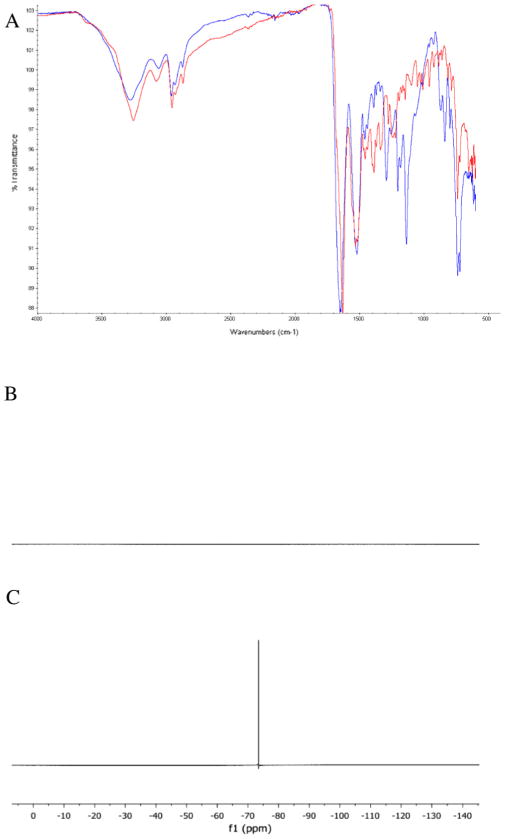
Fig. 3.

The IR and 19F NMR spectra of wollamide B (2). (A) The overlay IR spectra of wollamide B, red refers to the free base form, and blue refers to the TFA salt form; (B) The 19F NMR of the free base form of wollamide B; (C) The 19F NMR of the TFA salt form of wollamide B, showing the 19F signal at −73.47 ppm.
