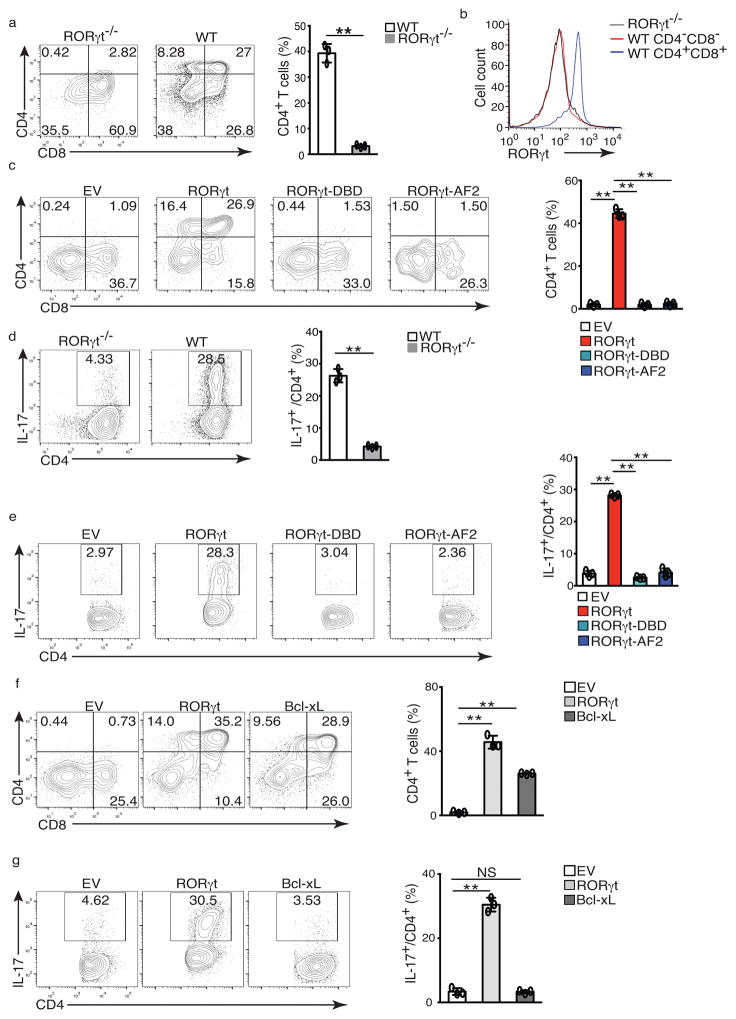
Figure 1. RORγt supports in vitro T cell development and TH17 differentiation.
(a) Flow cytometer analysis of CD4 and CD8 in ex vivo development of CD4−CD8− thymocytes from wild type or RORγt−/− mice for three days. Right panel is the frequency of total CD4+ thymocytes. (b) Flow cytometer analysis for RORγt expression by cells shown in a. (c) Flow cytometer analysis of ex vivo development of CD4−CD8−RORγt−/− thymocytes transduced with retrovirus expressing GFP only (EV), or together with RORγt or mutants incapable of binding DNA (RORγt-DBD) or co-activator (RORγt-AF2). Right panel is the percentage of CD4+ among 7-AAD− Thy1.2+GFP+ cells. (d) Flow cytometer analysis for IL-17A+ cells in naïve WT or RORγt−/− CD4+ T cells polarized under Th17 priming conditions for three days. Right panel is the percentage of IL-17A+ cells among CD4+ cells. (e) Flow cytometer analysis of IL-17A+ cells in RORγt−/− CD4+ T cells transduced with indicated retrovirus. Right panel is the percentage of IL-17A+ cells among CD4+GFP+ cells. (f) Flow cytometer analysis of ex vivo development of CD4−CD8−RORγt−/− thymocytes transdced with indicated retrovirus. Right panel is the quantification of the results. (g) Flow cytometer analysis of IL-17A+ cells in RORγt−/− CD4+ T cells transduced with indicated retrovirus. Right panel is the quantification of results. Data in right panel of a,c,d,e,f,g are mean ± s.e.m. **P < 0.01, ***P < 0.001 (ANOVA test). Each symbol represents an individual experiment. Data are pooled from three experiments (right panel of a,c,d,e,f,g ), or are from one experiment representative of three experiments (b and left panel of a,c,d,e,f,g),

