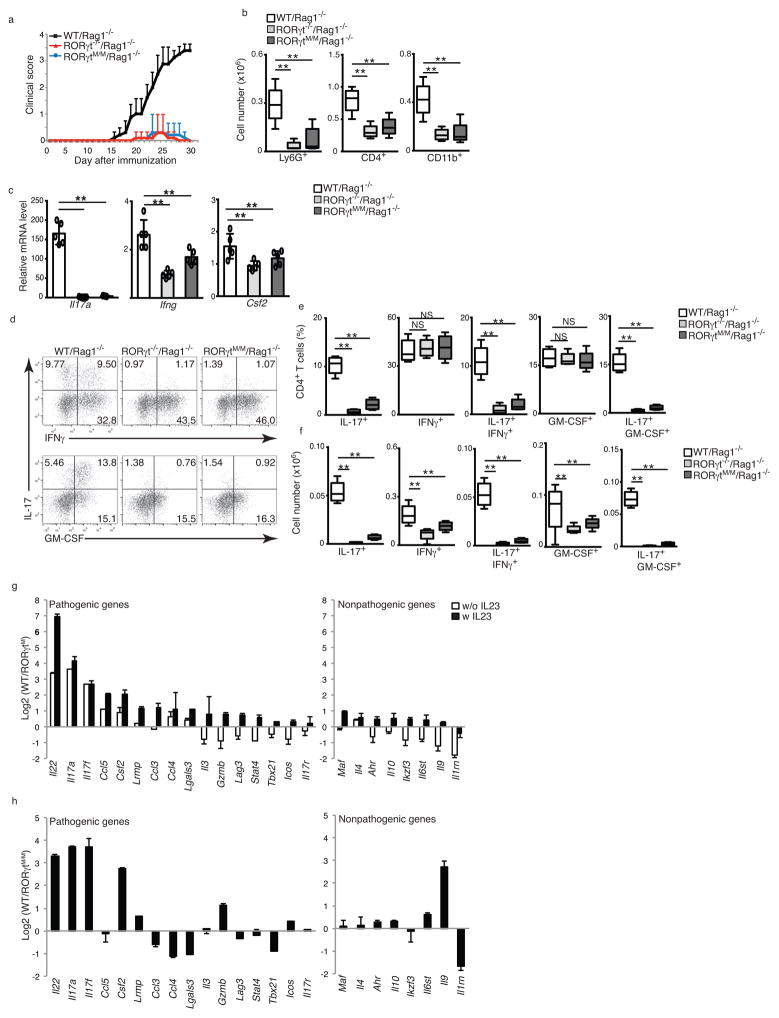
Figure 6. RORγtM/M CD4+ T cells are defective in induction of EAE.
(a) Mean EAE clinical score of Rag1−/− recipient mice (female) reconstituted with CD4+ cells from indicated mice at different days after immunization with MOG35-55 (n=5 per genotype). (b) Flow cytometer analysis of indicated surface markers for different types of CNS infiltrated lymphocytes in EAE-induced mice at the peak of disease. (c) qPCR analysis of expression of indicated cytokines in CNS-infiltrated lymphocytes of EAE-induced mice. (d) Flow cytometer analysis of intracellular IFNγ and GM-CSF in CNS-infiltrated CD4+ T cells from EAE-induced mice. (e, f) Percentage (e) and absolute number (f) of indicated CNS-infiltrated lymphocytes in EAE-induced mice. (g) Ratio of the expression of pathogenic and nonpathogenic genes determined by qPCR between WT and RORγtM CD4+ T cells differentiated under regular Th17 priming conditions and pathogenic Th17 priming conditions (+IL-23) for three days (n=3 per genotype). (h) Ratio of the expression of pathogenic and nonpathogenic genes determined by qPCR between WT and RORγtMM CD4+ T cells obtained from EAE-induced mice (n=3 per genotype). Data c are mean ± s.e.m. **P < 0.01, NS non-significant (ANOVA test). Each symbol (c) represents an individual mouse. Central line of box-whisker plot (b, e and f) represents median and whiskers indicate extreme data points. Data are pooled from three experiments (a,b,c,e,f,g and h), or from one experiment representative of three experiments (d).

