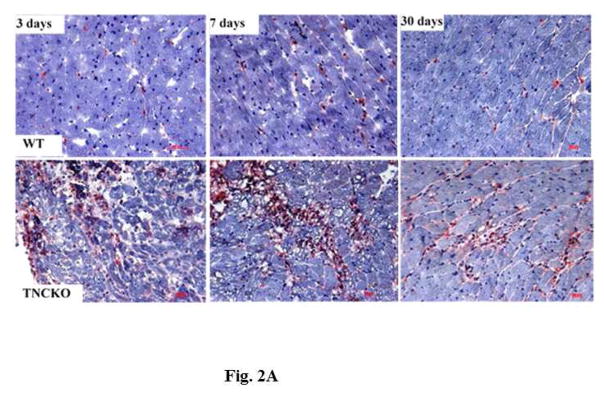
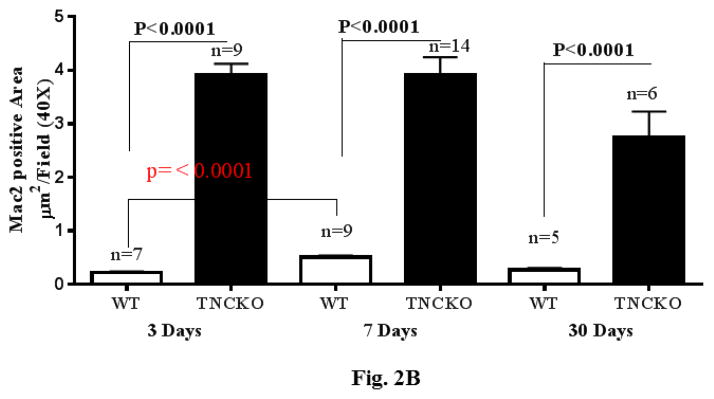
Figure 2. Leukocyte Infiltration.
(A) Representative Mac-2 staining of sections from the LV of TNCKO and WT mice subjected to TAC show infiltration elevation and decline at 3, 7, and 30 days. (B) At each post-TAC timepoint, TNCKO mice had significantly higher levels of infiltration. Abbreviations as in Figure 1.


