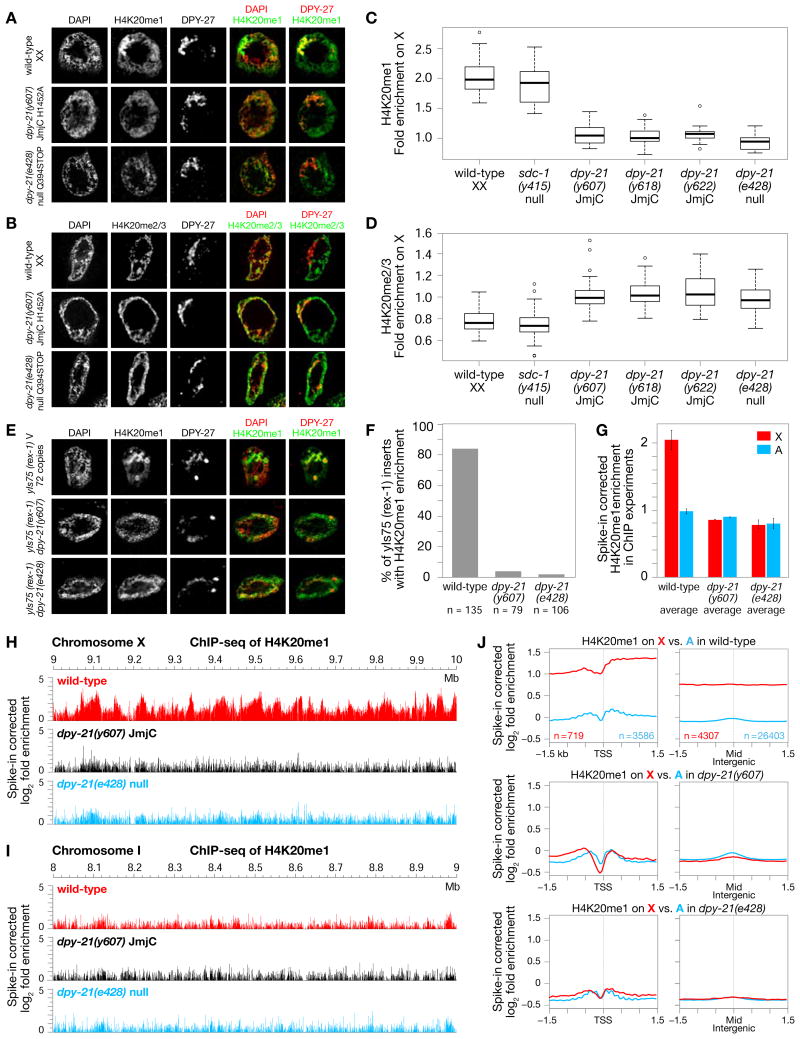
Figure 2. DPY−21 Demethylase Enriches H4K20me1 on X in vivo.
(A), (B) Confocal images of gut nuclei from wild-type and dpy−21 mutants show H4K20me1 (A) and H4K20me2/me3 (B) levels on X vs. autosomes, with DPY−27 marking X.
(C), (D) Boxplots summarize H4K20me1 or H4K20me2/me3 levels on X relative to their average levels on all chromosomes of wild-type and mutant nuclei. Boxes, middle 50% of ratios. Center bars, medians. X chromosomes of dpy−21(null) and dpy−21(JmjC) mutants have reduced H4K20me1 (p < 10−14) and enhanced H4K20me2/me3 (p < 10−9) relative to wild-type. H4K20me1 enrichment (p = 0.1) and H4K20me2/me3 depletion (p = 0.2) are not different in sdc−1(null) vs. wild-type. P values, 2-sided Wilcoxon rank-sum test.
(E) DPY−21 tethering to ectopic rex−1 DCC binding sites inserted on chromosome V caused JmjC-dependent H4K20me1 enrichment in gut nuclei. Scale bars (A), (B), (E), 2 μm.
(F) Quantification of DPY−27-marked rex insertions with HK20me1 enrichment from confocal images of strains in (E).
(G) Spike-in corrected H4K20me1 enrichment on X (red) vs. autosomes (blue) in ChIP-seq assays reveals significant decrease in H4K20me1 on X in dpy−21(JmjC) or dpy−21(null) vs. wild-type embryos. Average enrichment of two biological replicates is shown for each genotype with error bars indicating SD.
(H), (I) ChIP-seq profiles show spike-in corrected H4K20me1 enrichment in representative regions of chr. X (H) and chr. I (I) in wild-type and dpy−21(JmjC) or dpy−21(null) mutant embryos.
(J) Average spike-in corrected H4K20me1 enrichment plotted across transcription start sites (TSS) defined by GRO-CAP and GRO-seq (Kruesi et al., 2013) or across the middle of intergenic regions on X (red) and autosomes (blue). Similar decreases in H4K20me1 were found on all regions of X in dpy−21 mutants vs. wild-type. n, number of X or A regions in each set of related plots. See Figure S3.

