
Figure 6.
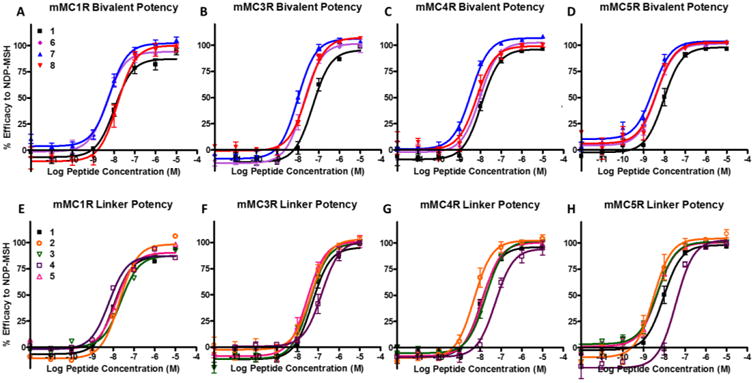
Illustrations of the in vitro functional pharmacology at the mMC1R, mMC3R, mMC4R, and mMC5R of the
 based ligands. Top figures show the bivalent ligands compared to the control peptide 1. The bottom figures show the effects of the linkers plus pharmacophore compared to control peptide 1.