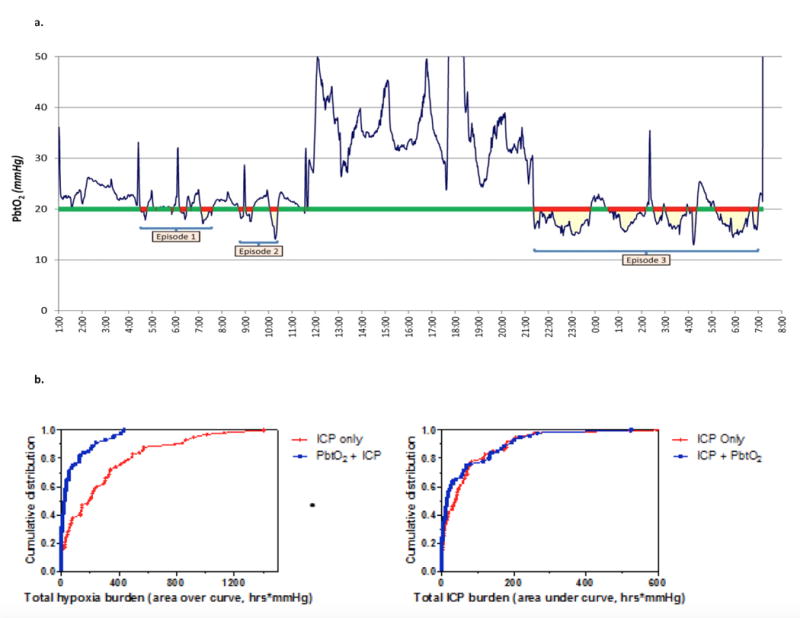
Figure 2.

Panel 2A: Sample trace of continuous PbtO2, illustrating how time of brain tissue hypoxia (red bars) and area over the curve (yellow) were assessed over time (x-axis). Panel 2B: Left Panel: Cumulative distribution of total hypoxia burden (area over the curve in hrs*mmHg) for each participant in BOOST-II. Mean hypoxia burden in 55 patients in PbtO2 and ICP treatment arm was 74.9 hrs*mmHg (95% CI 43.9 – 105.9), while for the 58 patients in the ICP only treatment arm mean hypoxia burden was 285.8 hrs*mmHg (95% CI 202.0 – 369.7), p < 0.0001. Right Panel: Cumulative distribution of total intracranial hypertension burden (area under the curve in hrs * mm Hg) for each participant in BOOST-II. Mean hypertension burden in 55 patients in PbtO2 and ICP treatment arm was 61.1 hrs*mmHg (95% CI 35.0 – 87.9) while for the 59 patients in the ICP only treatment arm mean hypertension burden was 67.9 hrs*mmHg (95% CI 42.5 – 93.4), p = 0.21.
