
Figure 1. Anatomical and Functional Connectivity between OT Neurons of the PVN and SON.
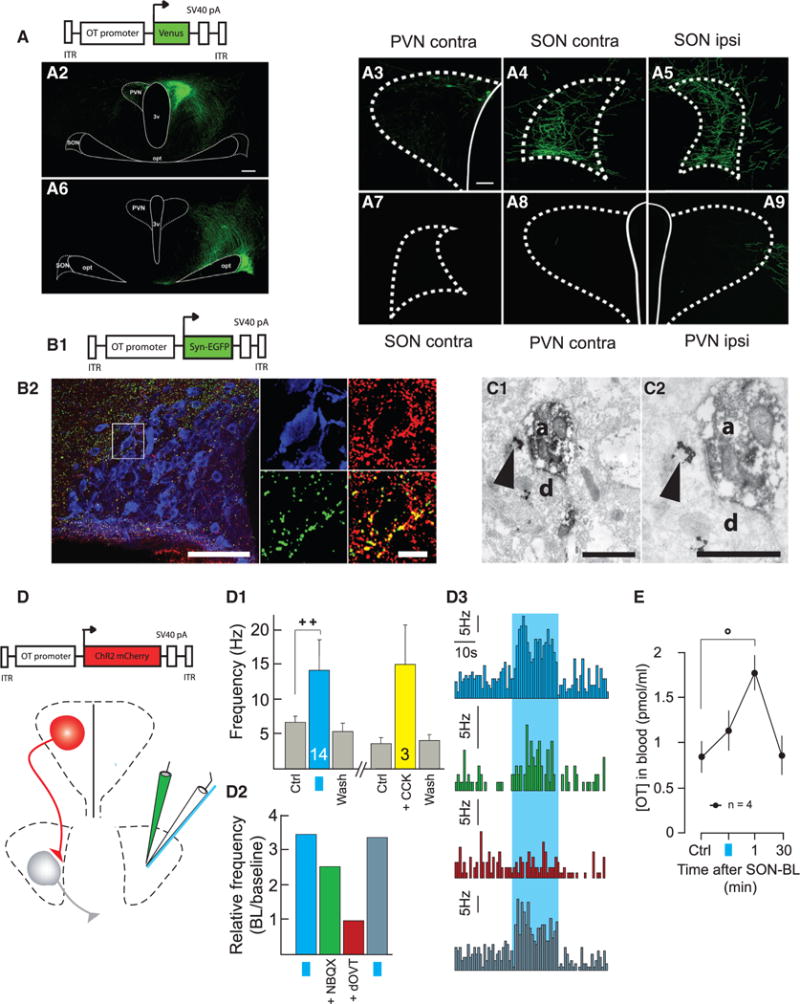
(A) OT projections from PVN to SON.
(A1) Scheme of the viral vector used to infect PVN neurons.
(A2–A9) PVN OT neurons infected with cell-type specific viral vector project Venus-positive axons to contralateral PVN (A3) and to contra- and ipsilateral SON
(A4 and A5). OT neurons of the SON (A6) do not project Venus axons to contralateral SON (A7) or PVN (A8) and only marginally enter the external border of ipsilateral PVN (A9). The scale bars represent 200 μm (left) and 50 μm (right).
(B) OT axon terminals contain vGluT2.
(B1) Scheme of viral vector.
(B2) GFP-positive terminals in the area of the SON (left). In the magnified inset (right), the OT neuron (blue) is surrounded by GFP terminals, which also contain vGlut2 (red). Both of the immunosignals overlap (yellow) in virtually all of the terminals. The scale bars represent 100 μm (left) and 25 μm (right).
(C–C2) Electron microscopy OT axon terminals (Venus visualized as diaminobenzidine [DAB] endproduct, OT, as a silver-gold-intensified DAB) form asymmetric synapses on OT-ir dendrite within the SON. The OT-immunoreactivity (clusters of silver particles, arrows) are shown in the presynaptic axon (a) terminal and postsynaptic dendrite (d) at lower (C1) and higher magnifications (C2). The scale bar represents 0.5 μm.
(D) Scheme of the viral vector and setup of in vivo electrophysiological recordings (white pipette) in SON, together with SON-BL stimulation (blue fiber) and drug infusion (green pipette).
(D1–D3) Functional connection between PVN and SON OT neurons. (D1) Average spike frequencies of SON OT neurons before (Ctrl), after either SON-BL (n = 14, blue bar) or systemic injection of CCK (n = 3, yellow bar), and after washout effect (Wash). (D2) Relative frequency increase induced by SON-BL in control condition (blue bar), after infusion of NBQX (1 μM, 0.5 μl; green bar), after additional infusion of dOVT (1 μM, 0.5 μl; red bar), and after 30 min washout of the drugs (dark blue bar). (D3) Histograms of the frequency rates recorded under conditions described in (D2).
(E) Effect of unilateral SON-BL effect on OT blood concentration at the end of SON-BL, 1 min and 30 min after (n = 4). All results are expressed as average ± SEM. The statistical significances: ++ p < 0.01 and Wilcoxon’s test. (°p < 0.05, Friedman’s test followed by Dunn post hoc test) The blue squares represent 20 s BL stimulation at 30 Hz with 10 ms pulses of BL stimulation.