
Figure 3. ParvOT Neurons Project to SC and Innervate NK1R/OTR WDR Neurons in Deep Laminae.
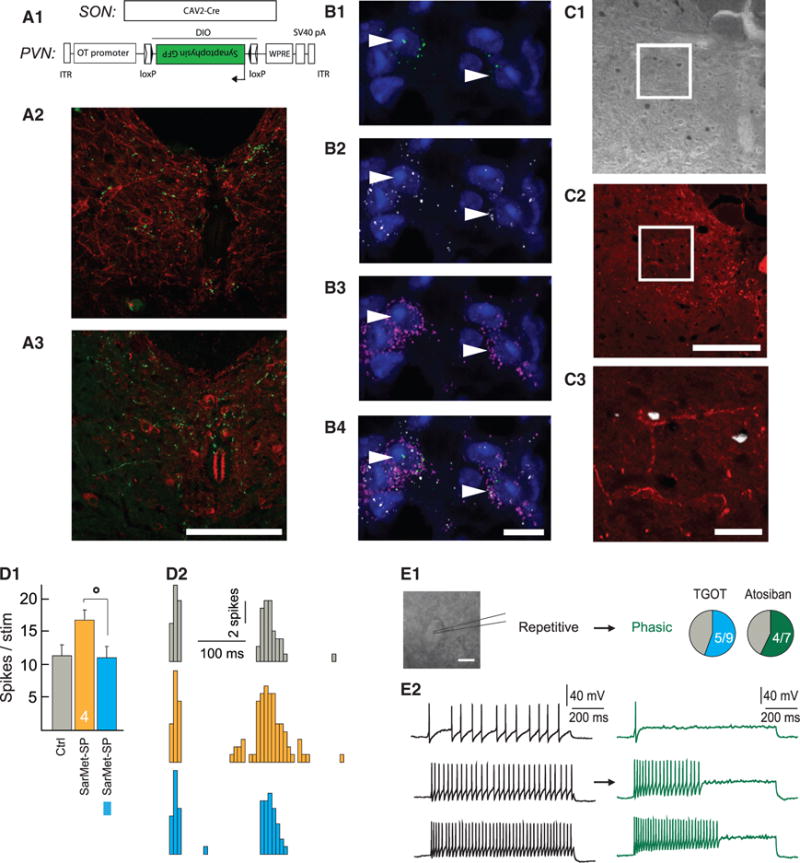
(A) ParvOT projections to the SC.
(A1) Scheme of the viruses injected into the SON and PVN.
(A2) Detection of synaptophysin-GFP containing terminals (green) in close proximity to NK1R-positive neurons (red) in SC deep laminae.
(A3) Synaptophysin-GFP terminals locate close to OTR-positive neurons of deep laminae. The scale bars represents 500 μm in (A2) and 500 μm in (A3).
(B–B4) Colocalization of NK1R and OTR mRNAs in the same neurons of SC deep laminae. Immunofluorescent in situ hybridization revealed the presence of OTR mRNA (green dots; B1 and B4) and NK1R mRNA (white dots; B2 and B4) in the same neurons, which were visualized by detection of vGlut1/2/3 mRNAs in their somas (pink/violet dots; B3 and B4). The nuclei of cells were stained by DAPI. The arrow heads point NK1R/OTR double positive neurons. The scale bars represent 10 μm.
(C–C3) NK1R-positive SC neurons start to express c-Fos after intraplantar injection of capsaicin in the hindpaw. The c-Fos signal (DAB) was detected in deep laminae of SC (C1), where the NK1R (red) were located (C2). The digital overlay of the two signals demonstrates localization of c-Fos in the NK1R-postive neuron
(C3). The scale bars represent 500 μm in (C1) and (C2) and 50 μm in (C3).
(D) WDR C-fiber evoked spikes in response to a series of isolated hindpaw stimulations in control condition (Ctrl), during application of the specific agonist of NK1R SarMet-SP (orange), and during SarMet-SP paired with BL (blue).
(D1) Average of C-fiber evoked spikes (n = 5).
(D2) Representative traces.
(E) Discharge profile of putative WDR recorded in current clamp applying a protocol of depolarizing current injections before (black) and after bath application of 1 μM TGOT (blue, n = 9) or 1 μM Atosiban (green, n = 7).
(E1) Proportion of putative WDR neurons discharge pattern changed from repetitive to phasic after TGOT or Atosiban bath application.
(E2) Example response of putative WDR neuron to 20 pA (top), 40 pA (middle), and 60 pA (bottom) current injection before (black) and after (green) Atosiban bath application. The scale bar represents in (E1) 30 μm. All results are expressed as average ± SEM. The statistical significance: °p < 0.05, Friedman’s test followed by Dunn post hoc test.