
Figure 5. Stimulation of ParvOT PVN Axons in SON and SC Modulates Responses of WDR Neurons.
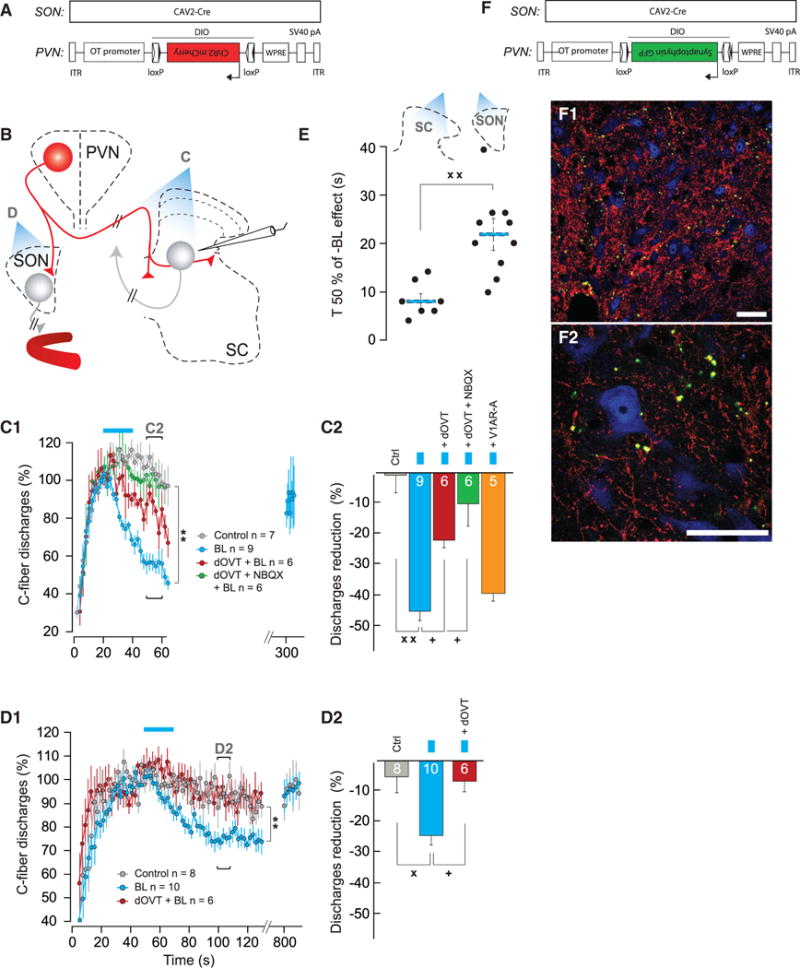
(A) Viruses injected into the SON and PVN.
(B) Scheme of the experimental procedures.
(C) Effect of SC-BL on WDR-C discharges.
(C1) Time course of WDR-C in control condition (n = 7), when shining SC-BL alone (n = 9), after local dOVT application (n = 6), or local dOVT + NBQX application (n = 6).
(C2) Average discharge reduction of WDR-C on Ctrl (n = 7), when shining SC-BL alone (n = 9), after local dOVT application (n = 6), local dOVT + NBQX application (n = 6), or local V1AR-A application (n = 5). The statistical significance of drug modulation of the SON-BL effect was assessed by comparing the effect of SON-BL on the same neuron before and after drug injection.
(D) Effect of SON-BL on WDR-discharges.
(D1) Time course of WDR-C in control condition (n = 8), measured 30 s after shining SON-BL (as indicated in C1) alone (n = 10), or after systemic dOVT systemic injection (n = 6).
(D2) Average discharge reduction of WDR-C on Ctrl (n = 8), when shining SON-BL alone (n = 10), or after systemic dOVT injection (n = 6). The statistical significance of dOVT modulation of the SON-BL effect was assessed by comparing the effect of SON-BL on the same neuron before and after dOVT injection (n = 6).
(E) Comparison between individual (black dots) and average T 50% (blue bar) effect of SON-BL (n = 10) and SC-BL (n = 7) on recorded WDR.
(F) Viruses injected into the SON and PVN.
(F1 and F2) Axonal terminals containing synaptophysin-GFP fusion protein in proximity to SC L5 neurons.
(F1) Overview of fiber distribution within SC: VGluT2 (red), synaptophysin-GFP (green), and NeuN (blue).
(F2) A zoom-in shows the green signal (green) largely overlaps with the VGluT2 signal (red) in terminals surrounding cell bodies. The scale bars represent 50 μm in (F1) and (F2). All results are expressed as average ± SEM. The statistical significance: °p < 0.05, Friedman with Dunn post hoc test; + p < 0.05, ++ p < 0.01, and Wilcoxon’s test; xx p < 0.01 and Kruskal and Wallis test; and ** p < 0.01 BL versus Control, two-way ANOVA.