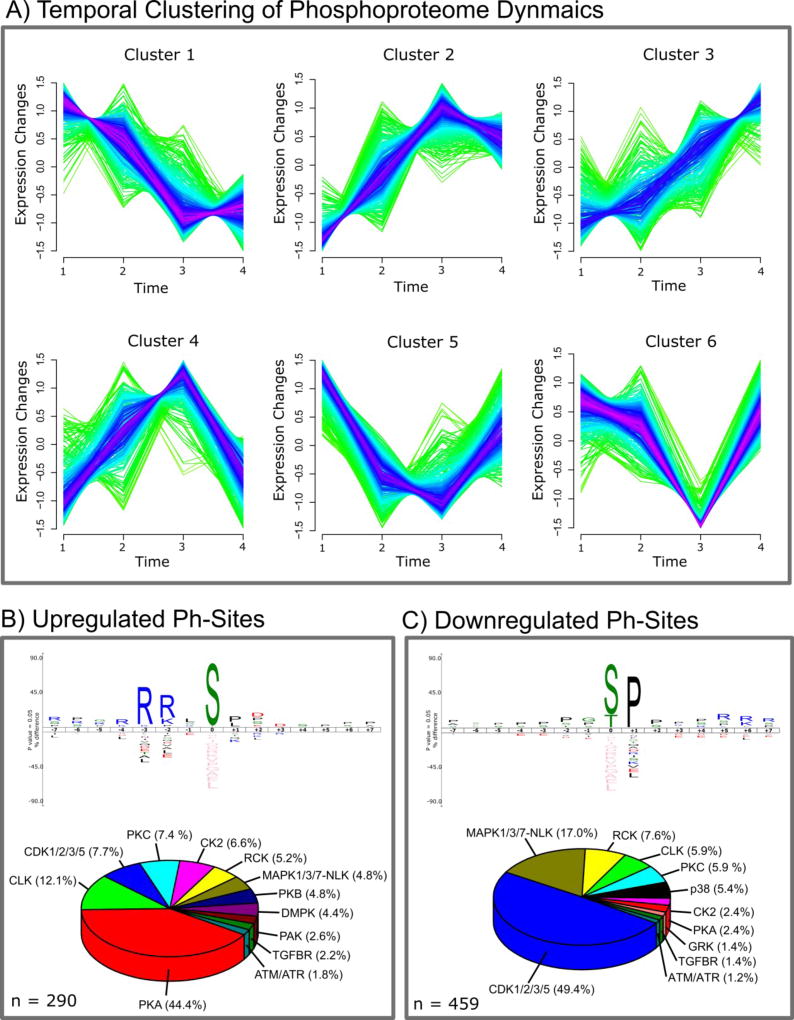
Figure 3.
A) Temporal clustering of phosphorylation changes quantified in the phosphoproteomics PDE4 and 8 inhibition time series experiment. Clustering was performed using the Mfuzz package in R with six clusters, only considering sites that are quantified in all experiments and that have a minimum abs log2 SILAC ratio of 0.2. B) and C) IceLogos created from the ±7 aa sequence window of significantly up- or down-regulated phosphorylation sites and pie charts of predicted upstream kinases targeting these phosphorylation sites. Sites were considered up- or down-regulated if increased or decreased in the 1 h PDE inhibition experiment or if they could be clustered to the corresponding temporal clusters (upregulated = cluster 2, 3, 4 and down-regulated = cluster 1, 5, 6) for sites derived from the time series experiment. Sequence logos were created using IceLogo 1.2 with the entire Mus musculus genome as background data set. Upstream kinases were predicted with the NetPhorest web tool (http://www.netphorest.info/index.shtml) using mouse protein sequences and human kinase substrate consensus sequences. Only predicted kinases were considered that showed a NetPhorest score of >0.1.

