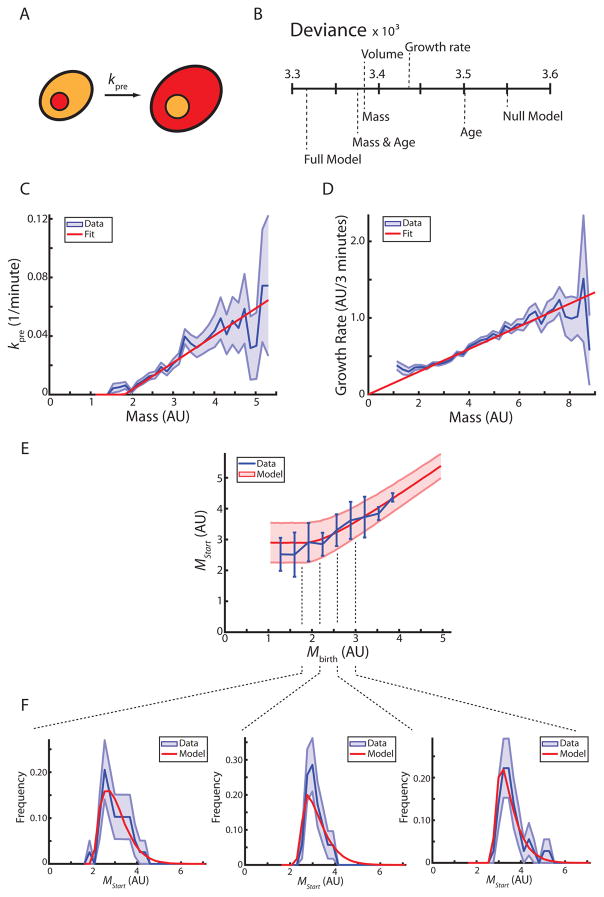
Figure 2. Pre-Start size control is recapitulated by a model based on a mass-dependent rate of passing Start.
(A) Schematic illustrating pre-Start G1 in daughter cells. Whi5-mCherry (red) nuclear exit defines passage through Start. (B) Logistic regressions identify cell size (volume or mass) as the major predictive parameter for passage through Start. Deviance measures how much of the data is not explained by the model (see methods). (C) The rate at which cells pass Start is shown as a function of cell mass (blue, +/− standard error). A linear fit (red) is used in the model. (D) The growth rate of daughter cells (amount of growth between two frames, 3 minutes) is shown as a function of cell mass (blue, +/− standard error). A linear fit, as expected from exponential growth, is shown in red. (E) Cell mass at Start is shown as a function of birth mass (blue, +/− standard deviation). Model prediction is shown in red (+/− standard deviation, n=165). (F) Marginal distributions of mass at Start conditioned on birth mass from (E) showing data (blue) and model (red). Standard deviation is estimated from 10000 bootstraps of the data. See also Figure S2, Table S1.

