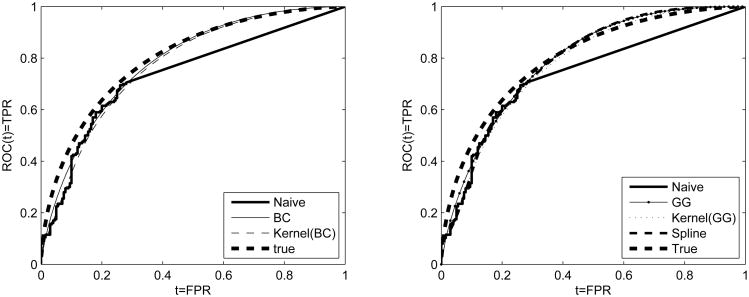
Figure 1.
Simulated data set of two normal distributions generated to attain true AUC=0.8 and expected level of censoring 50% due to a lower LOD. Left panel: Box-Cox (BC) and kernel(BC) based ROCs along with the true and the naive empirical. Right panel: Generalized gamma (GG), kernel(GG), and spline based ROCs along with the true and the naive empirical.

