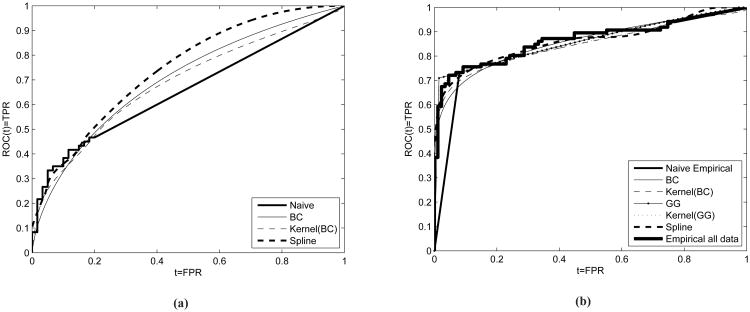
Figure 2.
Figure (2a): ROC curves for CEA that refers to colon cancer. AUCs for the Box-Cox, Kernel(BC), HCNS (spline) and naive empirical are 0.699, 0.686, 0.744 and 0.6566 respectively. Figure (2b): ROC curves for CA19-9 that refers to pancreatic cancer. AUCs for the Box-Cox, Kernel(BC), GG, kernel(GG), spline and naive empirical are 0.8577, 0.8474, 0.8657, 0.8569, 0.8627, 0.8428. The corresponding AUC for the empirical when using all available data is 0.8651. We note that even though it seems so, the GG based ROC estimate does not exhibit a step on the right panel. It simply has a very steep curvature close to TPR = 0.7.

