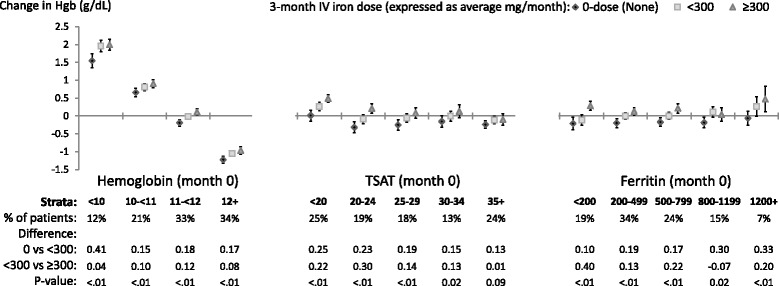
Fig. 1.

Adjusted change in Hemoglobin, from before to after IV iron dosing. Each stratum represents a separate model (14 total per figure) adjusted for age, sex, black race, time on dialysis, catheter use, BMI, region (Europe-ANZ, North America), 13 comorbid conditions, and the following measures at month 0: Hgb, white blood cell count; serum albumin, creatinine, ferritin, TSAT; and 3-month ESA dose (unless included in the outcome or strata). The vertical bars indicate 95% confidence intervals. Total sample size was 9,471
