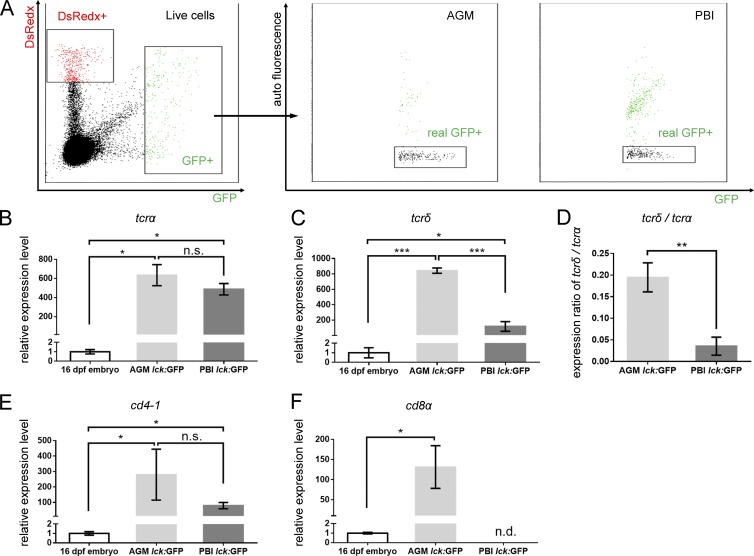
Figure 2.
Characterization of PBI-derived T cells. (A) Dot plot of FACS of lck:GFP+ cells from 16-dpf AGM-irradiated (left) and PBI-irradiated (middle) fish. GFP+ cells are gated from live cells, and autofluorescent cells are excluded by real-GFP+ gate. Three independent experiments (in each group, ∼20 fish are pooled together) are conducted. The cDNA are prepared from at least 250 lck:GFP+ cells isolated from 16-dpf AGM- and PBI-irradiated embryos and subjected to qPCR analysis. cDNA prepared from the whole 16-dpf embryos are used as a control. (B and C) Relative expression levels of tcrα and tcrδ in the AGM- and PBI-derived T cells. Three independent experiments are conducted. (D) Expression ratio of tcrδ to tcrα. The values are calculated on the basis of the expression level of tcrα and tcrδ relative to the internal control gene (elf1a). (E and F) Relative expression levels of cd4-1 and cd8α in the AGM- and PBI-derived T cells. Three independent experiments are conducted. Data are represented as mean ± SD. Unpaired, two-tailed t test was performed to determine significance. *, P < 0.05; **, P < 0.01; ***, P < 0.001. See also Fig. S4.

