Figure 3.
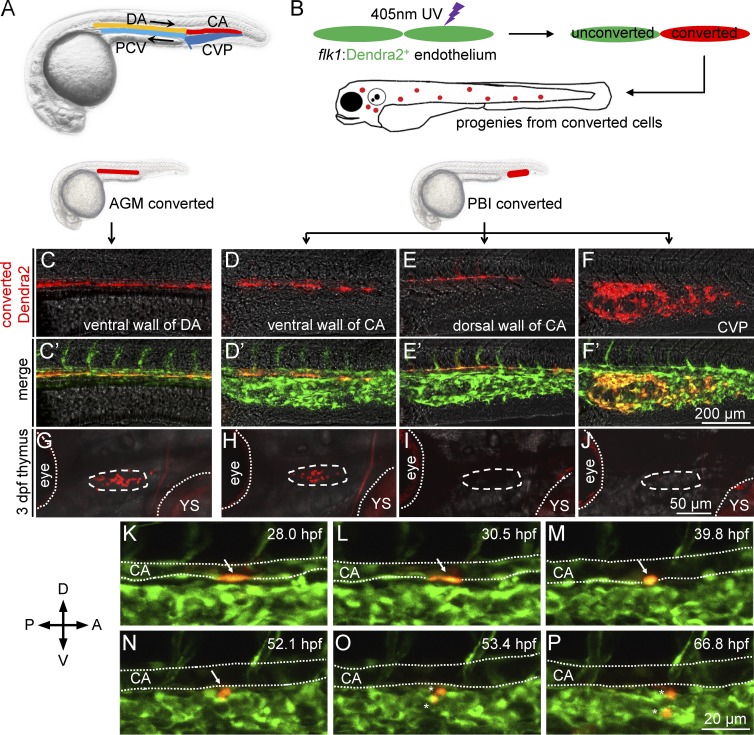
PBI-derived T cells originate from the ventral endothelium of caudal aorta. (A) A schematic diagram of the anatomy of main blood vessels in 28-hpf zebrafish embryos. CA, caudal aorta (red); CVP, caudal vein plexus (dark blue); DA, dorsal aorta (orange); PCV, posterior cardinal vein (light blue). Black arrows indicate direction of blood flow. (B) A schematic diagram of photoconversion of flk1:Dendra2+ vessel endothelial cells in 28 hpf Tg(flk1:Dendra2+) embryos. Fluorescent color of Dendra2 changes from green to red after exposure to 405-nm UV laser. (C–F) Red fluorescence of Dendra2+ cells after photoconversion at 28 hpf. The ventral wall of DA, the ventral wall of CA, the dorsal wall of CA, and the CVP are photoconverted using 405-nm UV laser. Fluorescence images are captured immediately after photoconversion. (C′–F′) Merged images of converted (red) and unconverted (green) endothelial cells corresponding to C–F. (G–J) Red Dendra2 signals in the thymus of photoconverted fish. Red Dendra2 signals are detected in the thymus of the 3-dpf embryos photoconverted in the ventral wall of DA (4 of 4) and ventral wall of CA (7 of 8) but not those photo-converted in the dorsal wall of CA (0 of 9) or the CVP (0 of 10). Dashed circles depict the thymus. Dotted lines depict the boundaries of the eyes and YS. (K–P) Time-lapse confocal imaging of the PBI region of Tg(flk1:Dendra2) embryo after photoconversion. A photoconverted endothelial cell (arrows) in the ventral wall of CA undergoes EHT and subsequently divides into two daughter cells (asterisks). The endothelial cell is converted at 28 hpf and traced for ∼40 h. The lumens of CA are depicted by dotted lines. A, anterior; D, dorsal; P, posterior; V, ventral.

