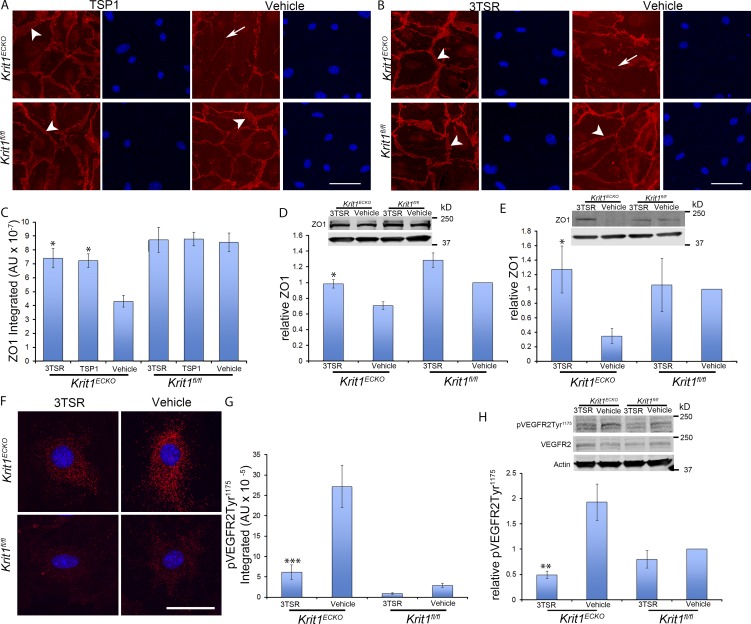
Figure 4.
Reconstitution of TSP1 prevents the tight junction loss that follows inactivation of Krit1. (A) 5 nM mouse recombinant TSP1 (mrTSP1) was added to cultured Krit1ECKO BMEC 72 h after initial treatment with 4-hydroxy-tamoxifen. Note continuous ZO-1 junctional staining in TSP1-treated Krit1ECKO BMEC (arrowheads), resembling the appearance of Krit1fl/fl BMEC. In sharp contrast, ZO-1 staining was reduced and discontinuous (arrows) in vehicle-treated Krit1ECKO. (B) Treatment with an anti-angiogenic domain (20 nM), 3TSR. The arrows in Krit1ECKO BMEC indicate immunostaining for ZO-1 that is punctate and reduced at the cell–cell contacts. Treatment with 3TSR prevented loss of ZO-1 protein from tight junctions in Krit1ECKO BMEC (arrowheads). (C) Quantification of ZO-1 protein expression in BMEC. Krit1ECKO or control Krit1fl/fl BMEC treated with TSP1, 3TSR, or vehicle as indicated (SEM, n = 3). (D) ZO-1 protein levels as determined by Western blot analysis in Krit1ECKO and Krit1fl/fl BMEC in the presence or absence of 20 nM 3TSR (SEM, n = 3). Bottom row is actin loading control. (E) Quantification of ZO-1 protein expression in cerebellar tissue in Krit1ECKO and control Krit1fl/fl mice treated with 3TSR or vehicle (SEM, n = 4 mice in each group). Bottom row is actin loading control. (F) VEGFR2-Tyr1175 phosphorylation in primary BMEC Krit1ECKO or control Krit1fl/fl BMECs treated with 3TSR or vehicle. Nuclei were counterstained with DAPI (blue). (G) Quantification of VEGFR2-Tyr1175 phosphorylation in BMECs is shown as integrated density in Krit1ECKO and Krit1fl/fl controls in the presence or absence of 20 nM 3TSR (SEM, n ≥ 47 cells). (H) Quantification of VEGFR2-Tyr1175 phosphorylation in cerebellar tissue in Krit1ECKO and control Krit1fl/fl treated with 3TSR or vehicle 30 min after VEGF treatment (75 µg/Kg), as assessed by Western blot analysis (SEM, n = 4 mice in each group). Bar: (A and B) 50 µm; (F) 25 µm. *, P < 0.05; **, P < 0.01; ***, P < 0.001 versus vehicle-treated Krit1ECKO ; determined by one-way ANOVA followed by Tukey’s post hoc test (C and G) or Student’s t test (D, E, and H). Data in A–H are representative of at least three independent experiments.

