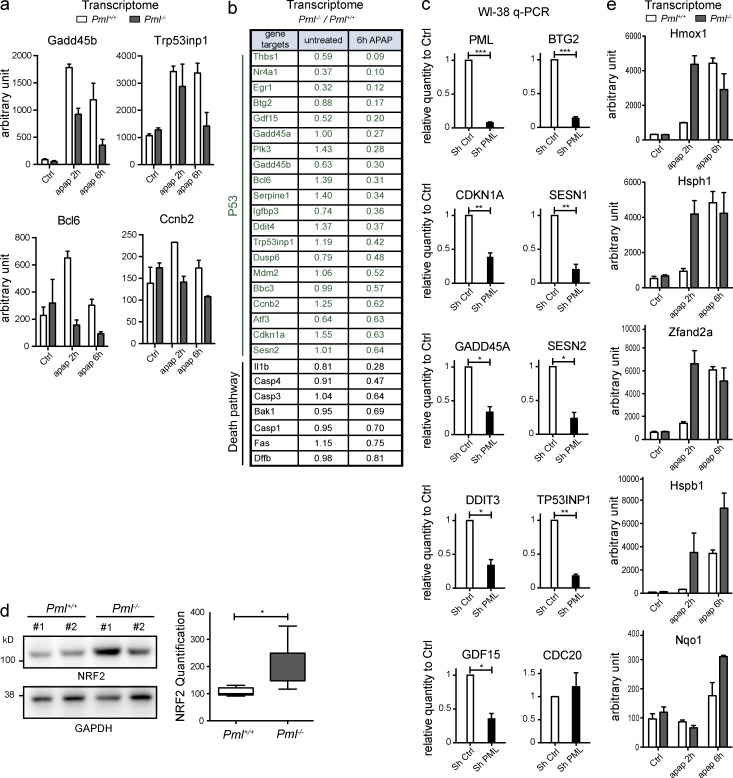
Figure 3.
Pml−/− mice fail to activate p53 upon oxidative stress. (a) Graphs representing transcript levels for the indicated p53 target genes determined by transcriptomic arrays of Pml−/− and Pml+/+ mouse livers 2 and 6 h after APAP or vehicle injections. Mean values from two mice per condition are shown. Error bars represent SEM. (b) Table from the transcriptomic analysis in a indicating p53 targets and death regulators and the mRNA ratio in Pml−/− versus Pml+/+ mice. (c) Transcripts from WI-38 fibroblasts transduced with PML or control shRNA were quantified by quantitative PCR. Error bars represent SEM. *, P < 0.05; **, P < 0.01; ***, P < 0.001. (d) Western blot analysis of NRF2 protein from Pml−/− and Pml+/+ mouse livers (left; two representative untreated mice). Box and whisker plot (Tukey) showing NRF2 protein quantification from six mice (right; Mann–Whitney test: *, P < 0.05). (e) Levels of NRF2 target mRNAs (transcriptomic analysis in b) 2 h or 6 h after APAP treatment. Error bars represent SEM.

