Figure 6.
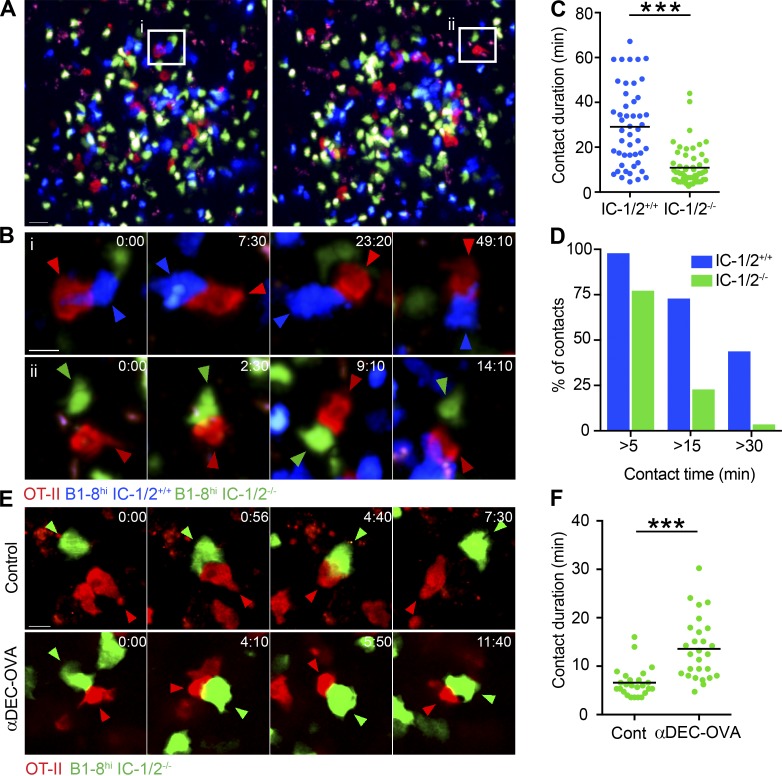
Long-lasting and pMHCII-dependent Tfh–B cell interactions depend on B cell ICAMs. (A) Images show clusters of DsRed+ OT-II T cells (red), CFP+ IC-1/2+/+ B1-8hi B cells (blue), and CFSE-labeled IC-1/2−/− B1-8hi B cells (green) within popliteal LNs 2 d after immunization with NP-OVA. Representative T–B interactions shown in B are marked by white rectangles. Bar, 20 µm. Images correspond to Video 1. (B) Dynamics of T–B interactions. Red, blue, and green arrowheads indicate T cells, IC-1/2+/+, and IC-1/2−/− B cells, respectively. Bar, 5 µm. Images correspond to Videos 2 and 3. (C and D) Analysis of contact duration of OT-II T cells with either IC-1/2+/+ or IC-1/2−/− B1-8hi B cells. Total contacts (C) and interactions binned according to duration (D) are shown. Data represent two to three independent experiments with two to three mice total for each group. (E) Dynamic interactions of DsRed+ OT-II T cells and GFP+ IC-1/2−/− B1-8hi B cells 4–8 h after injection of anti–DEC205-OVA or PBS (control). Red and green arrowheads indicate T cells and IC-1/2−/− B cells, respectively. Bar, 10 µm. Images correspond to Videos 4 and 5. (F) Analysis of contact duration of OT-II T cells with IC-1/2−/− B1-8hi B cells. Data represent two independent experiments with two to three mice total for each condition. In C and F, each dot in the graphs represents a single T–B interaction; lines represent the mean. ***, P < 0.0001; two-tailed Student’s t test.

