
Fig. 3.
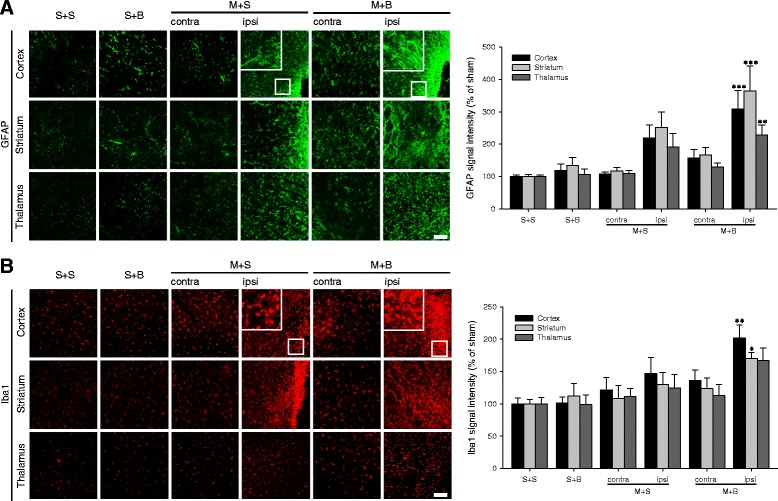
Neuroinflammation measured by astroglial and microglial activation. a Glial fibrillary acidic protein (GFAP) immunoreactivity and its quantification. b Iba1 immunoreactivity and its quantification. n = 6 to 8 in each group; scale bar = 100 μm; *p < 0.05, **p < 0.01, and ***p < 0.001 on the post hoc analysis compared to S + S; MCAO middle cerebral artery occlusion, BCCAo bilateral common carotid artery occlusion, S + S sham + sham, S + B sham + BCCAo, M + S MCAO + sham, M + B MCAO + BCCAo