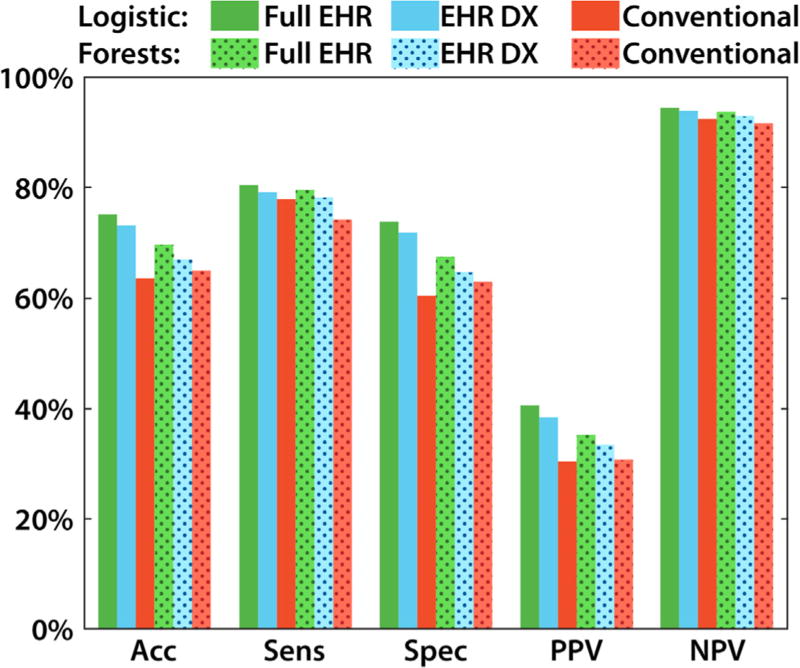
Fig. 2.
The performance of each type of algorithm (logistic and random forest) for each type of input data (full EHR, EHR DX and conventional). The threshold used to assess performance corresponded to an 18.1% prevalence of diabetes in the full dataset. For all algorithms, incorporating more EHR data led to higher performance in identifying DM2 and non-DM2 patients, compared to conventional algorithms. Shaded bars indicate random forest models. Error bars were too small to display meaningfully with 9948 subjects. Significance markings indicate hierarchical X2 tests for p < 0.05. Abbreviations: accuracy (acc), sensitivity (sens), specificity (spec), positive and negative predictive value (PPV and NPV).

