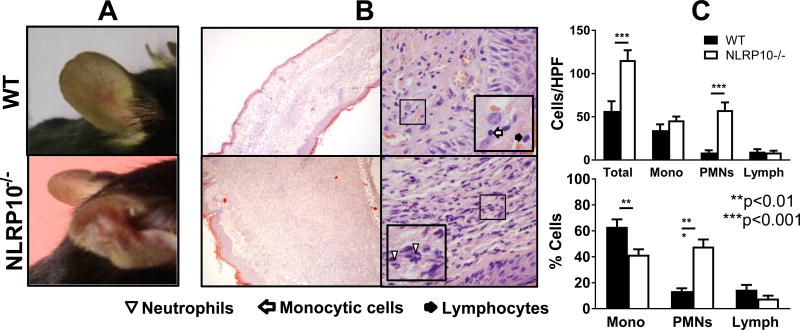
Figure 5. Late lesions: Late in L. major infection, ears of NLRP10−/− mice have increased tissue damage and enhanced infiltrating neutrophils compared to WT lesions.
(A) Photographs of ear lesions from representative infected WT and NLRP10−/− mice after 70 days of L. major infection, and (B) histologic sections of H&E-stained, L. major-infected ear tissue on day 98 post-infection are shown. The lesions of WT (upper images) and NLRP10−/− (lower images) are shown at 100X (left images) or 1000X (right images) magnification (0.25 N.A. or 1.3 N.A., respectively), with insets illustrating specific cell types. (C) The absolute number and the percentage of cells per high power field (HPF), were determined microscopically on day 98 post inoculation with L. major . The results were compiled from 3 experiments with at least 2 injected ears per group and expressed as the mean ± SEM. Statistical analyses were done by one way ANOVA.

