
Figure 2. Gene Expression Profiling Reveals Pan-Neuronal Identity Induced by miRNAs Alone.
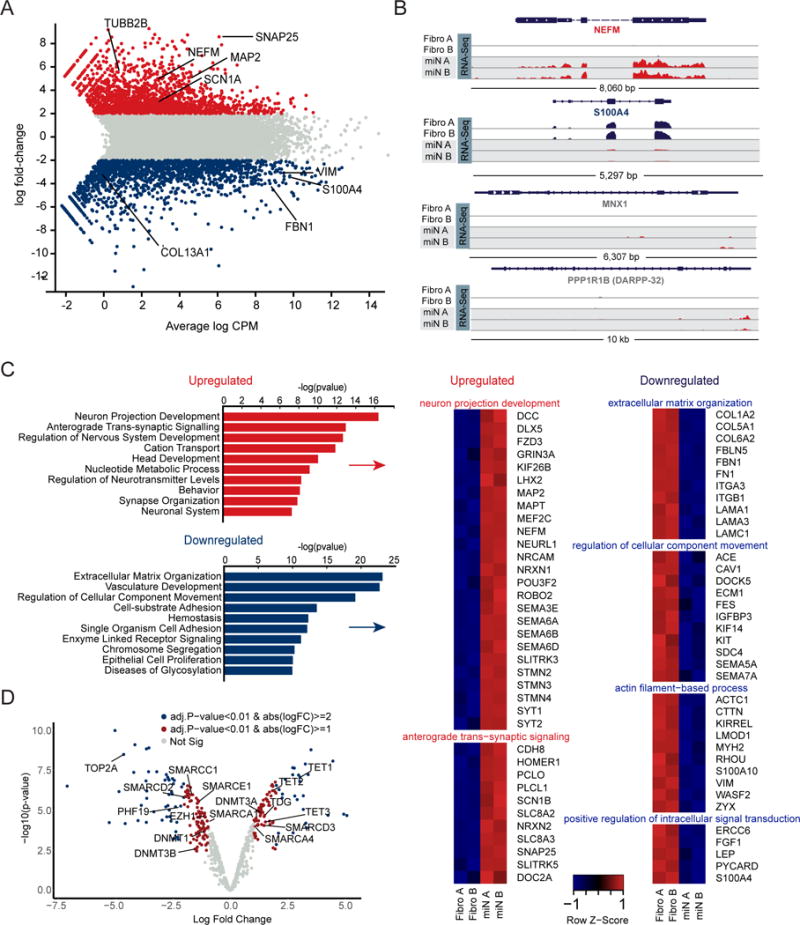
(A) Genome wide expression analysis of miNs and starting fibroblasts by RNA-seq at day 30 of reprogramming. Plot shows the relationship between average gene expression (logCPM) and log fold-change of miNs compared to fibroblasts. A selection of pan-neuronal and fibroblast-specific genes are highlighted in black text. Blue = fold change < −2 log2 p < 0.01 (more abundant in fibroblasts), grey = fold change > −2 log2 < 2 log2 p > 0.01, and red = fold change > 2 log2 p < 0.01 (more abundant in miNs). FDR < 0.01.
(B) Representative genome browser snapshots demonstrating increased expression for a pan-neuronal gene (NEFM), loss of fibroblast marker gene expression (S100A4), and absence of neuronal subtype marker gene expression (MNX1, motor neuron marker; DARPP-32, medium spiny neuron marker).
(C) Gene ontology (GO) terms associated with genes upregulated in miNs (red) and GO terms associated with genes downregulated in miNs (blue). Right, examples of genes that fall within top GO categories listed.
(D) Volcano plot representing chromatin modifier genes differentially expressed between fibroblasts and miNs. Blue dot, abs(logFC) > 2 and p < 0.01, red dot, abs(logFC) > 1 and p < 0.01, grey dot, no significant difference. See also Figure S2.