
Figure 3. Time Series Transcriptome Analysis Reveals Early Dynamic Gene Expression Changes Followed by a Stable Transcriptome Switch.
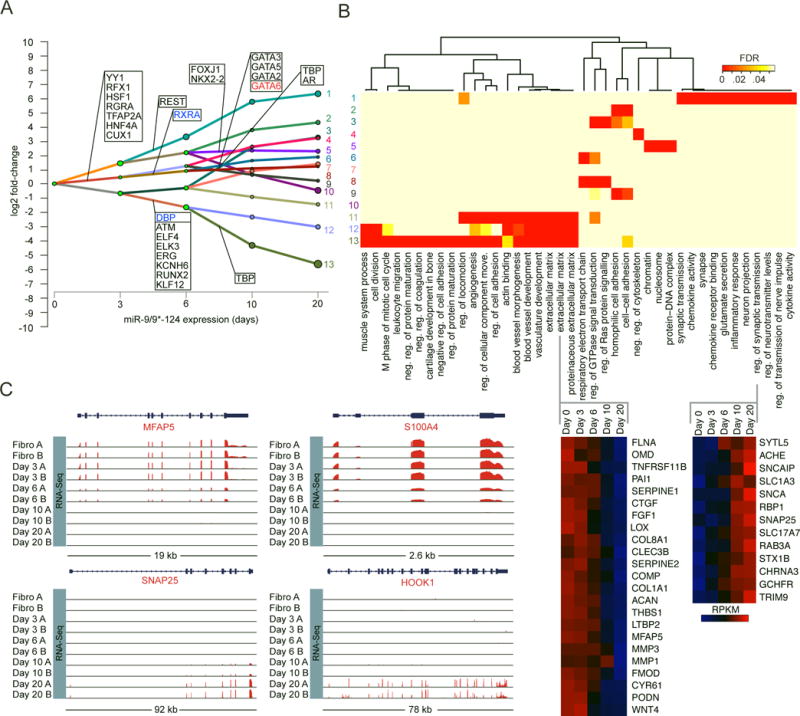
(A) Dynamic Regulatory Event Miner (DREM) analysis reveals multiple paths of co-regulated genes emerge over time (days). Genes shown in each rectangle represent predicted transcription factors that may underlie the transcriptome changes detected.
(B) GO terms enriched in each path (top) and heat maps of genes within the extracellular matrix and regulation of synaptic transmission terms (bottom). Z-score normalized RPKM.
(C) Representative genome browser snapshots demonstrating the time-dependent loss of fibroblast gene expression (top), emergence of pan-neuronal marker gene expression, and synaptic component expression (bottom).