
Figure 4. MiR-9/9*-124 Alter DNA Methylation at Neuronal Loci.
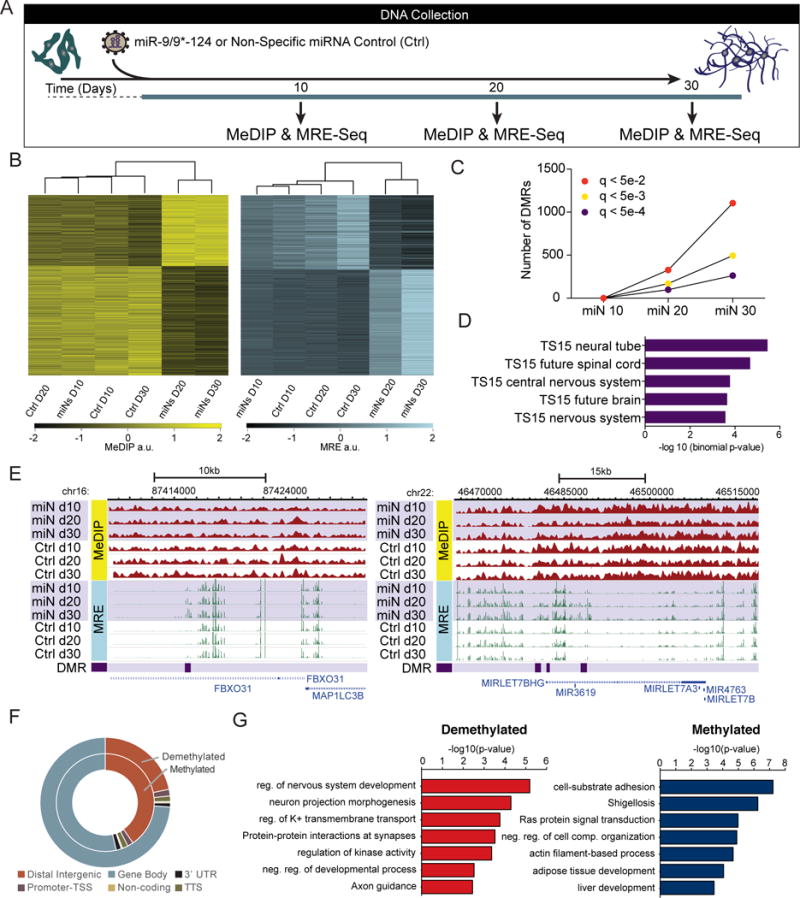
(A) Schematic of sample collection during miR-9/9*-124-mediated neuronal reprogramming for DNA methylation studies. Human fibroblasts were transduced with virus expressing miR-9/9*-124 or a non-specific (NS) control (Ctrl) virus at day 0. Samples were collected at day 10, day 20, and day 30.
(B) Biclustering analysis of DMRs. Heatmaps based on MeDIP-seq RPKM (left) and MRE-seq RPKM (right) showing overlapping DMRs at days 20 and day 30.
(C) Quantification of DMRs at multiple q-value cutoffs (q < 5e-2 in red; q < 5e-3 in yellow; q < 5e-4 in purple) across all time points: miN 10 (miN day 10 vs. Ctrl day 10), miN 20 (miN day 20 vs. Ctrl day 20), and miN 30 (miN day 30 vs. Ctrl day 30).
(D) Tissue development enrichment of top overlapping DMRs at day 20 and day 30 show neuronal tissue terms at TS15 (~E9/10 in mouse development).
(E) WashU Epigenome Browser screenshots of two DMRs: FBXO31 (left) and MIRLET7BHG (right) loci are shown with MeDIP-seq tracks (red; top), MRE-seq tracks (green; middle), and DMR positions (purple; bottom).
(F) Genomic distribution of differentially methylated and demethylated regions.
(G) Functional enrichment of top demethylated and upregulated (red; left) or methylated and downregulated (blue; right) DMRs overlapping at day 20 and day 30 compared with RNA-seq at day 30.