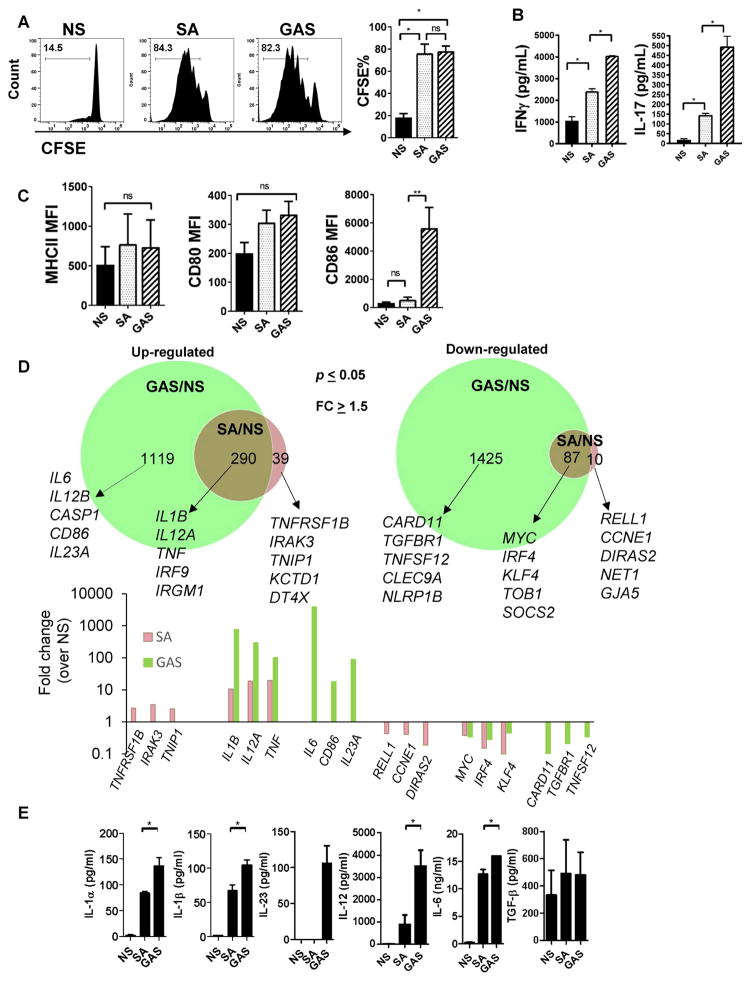
Figure 2. S. aureus induces suboptimal polarization of TH1 and TH17 cells associated with differential regulation of gene expression in DC.
(A)–(B) BMDC were cultured with medium only (NS – Non stimulated), S. aureus (LAC) or GAS (MOI=3) for 1hr, pulsed with OVA peptide (6hr) and then mixed with CFSE-labeled OTII transgenic CD4+ T cells. (A) CFSE dilution in gated CD4+ T cells at day 7 post stimulation and (B) IFN-γ and IL-17A in the culture supernatants after 7 days.
(C) MHCII, CD80 and CD86 expression on BMDC after 24hr of stimulation with GAS or S. aureus (MOI=10).
(D) Bone marrow-derived DC were left without any stimulation (NS) or incubated with S. aureus or GAS (MOI=3) for 8 hours and total RNA was extracted for RNAseq analysis. Top graph: Venn diagrams showing genes up- (left) or down- (right) regulated by S. aureus only (pink), GAS only (green) or both GAS and S. aureus (brown). Selected genes are listed for each group. Bottom graph: Fold change (over NS) for selected genes shown in (D).
(E) Cytokine production as measured by ELISA in the supernatant of DC treated as in (D) for 24 hours. All data are representative of at least 3 experiments except for the IL-23 ELISA which was performed twice. Data are shown as mean ± SEM and data analysis was performed using ANOVA. *p<0.05; **p<0.01. See also Figure S2 and Table S1 and S2.

