
Figure 2. Differential associations between T6SS and Bacteroides spp.
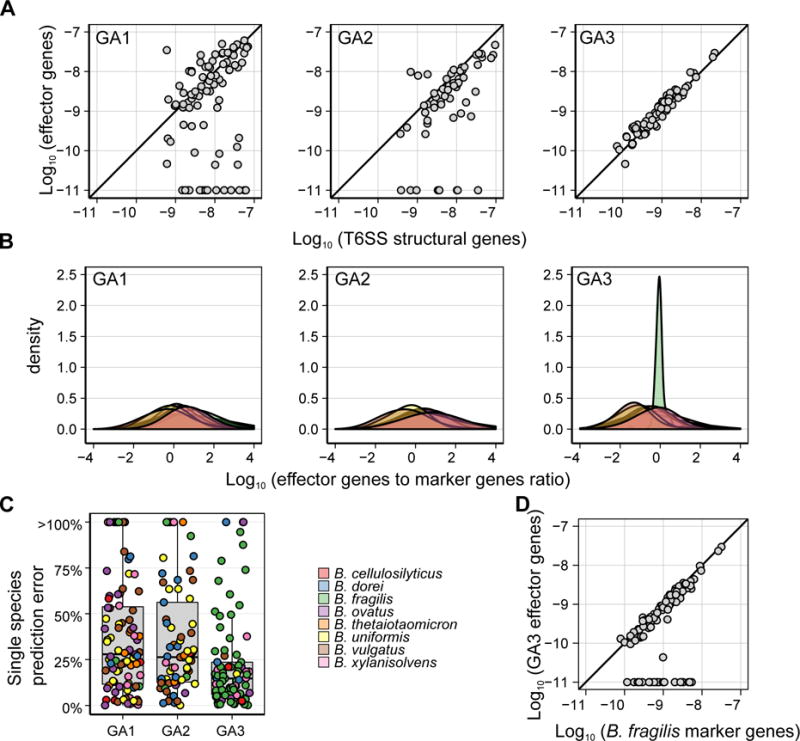
(A) Scatter plot of the average abundance of detected effector genes vs. the average abundance of T6SS structural genes for different subtypes. We have restricted our analysis to samples with at least 25 reads mapping to a given subtype. The strong correlation observed, and the very few samples in which structural genes but no effector genes can be found, testify to the completeness of our E–I pairs catalog. (B) Density plots showing the distribution across samples of the ratio between the average abundance of detected effector genes from each T6SS subsystem and the average abundance of species-specific marker genes for different Bacteroides spp. Only samples in which at least 100 reads mapped to the E–I genes of a given subsystem and only species for which at least 5 genomes were available (and therefore marker genes can be robustly inferred) are included. (C) A boxplot showing the minimal relative error in effector abundance assuming that the T6SS is encoded by a single species. The relative error is defined as the relative difference between the average abundance of detectable effector genes in a sample and the abundance of species with the closest abundance. The color of each point represents the species for which the minimal relative error was obtained. (D) Scatter plot of the average abundance of detected GA3 effector genes vs. the average abundance of B. fragilis-specific marker genes. Only samples in which B. fragilis is present are included. As in (A) each abundance was increased by 10−11. See also Figures S2 and S3.