
Figure 3. E–I turnover and strain replacement in infant microbiomes.
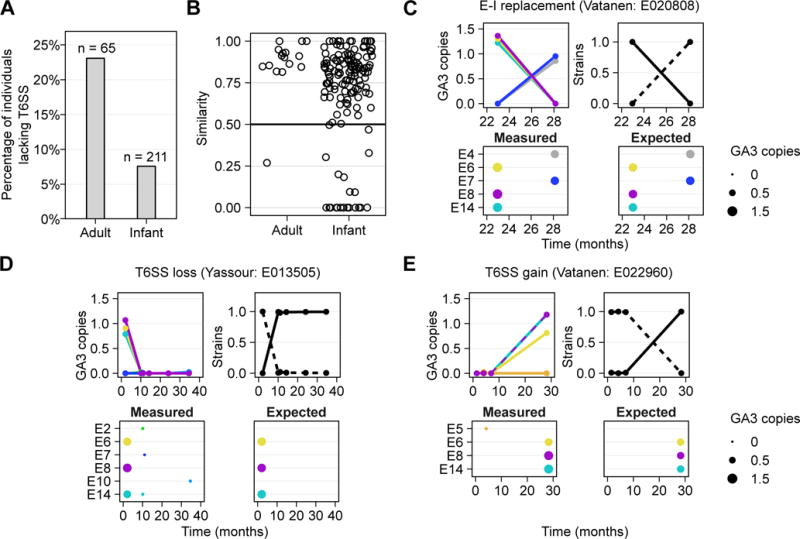
(A) The percentage of individuals of those harboring B. fragilis, that lack the GA3 T6SS across adult and infant datasets. (B) The minimal similarity (measured by the Jaccard similarity coefficient) in GA3 E–I gene content between the first time point and every subsequent time point in adults and infants. (C) Examples of E–I turnover events and corresponding strain replacement events are shown. The plots on the upper and bottom left in each panel illustrate the estimated abundance of GA3 effector genes (measured as copies per B. fragilis genome) over time, with the plot on the upper right illustrating the estimated frequency of inferred strains in these samples. Only samples in which B. fragilis is present are shown. The bottom right plot illustrates the expected abundance of the various effector genes based on the effector genes encoded by reference strains that are phylogenetically close to the inferred strains. See also Figure S4.