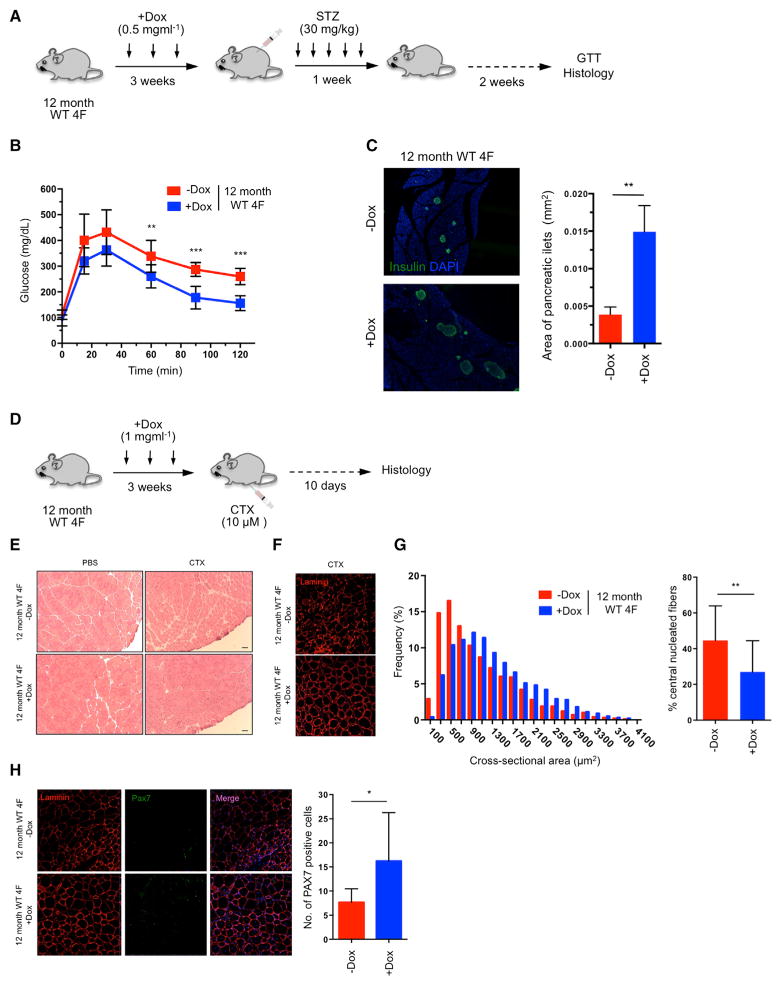
Figure 7. Improved Resistance to Metabolic Disease and Skeletal Muscle Injury in Aged WT Animals by In Vivo Reprogramming.
(A) Schematic representation of induction of pancreatic injury by low-dose (30 mg/kg) STZ following in vivo reprogramming in 12-month-old WT 4F mice.
(B) Glucose tolerance test (GTT) in 12-month-old WT 4F mice following beta cell ablation by low dose STZ (−Dox n = 6; +Dox n = 6). **p < 0.01 and ***p = 0.0005 according to two-tailed Student’s t test.
(C) Immunostaining of Insulin and quantification of pancreatic islet size in pancreas of 12-month-old WT 4F mice 2 weeks following STZ. **p < 0.005 according to two-tailed Student’s t test.
(D) Schematic representation of induction of muscle injury by CTX following in vivo reprogramming in 12-month-old WT 4F mice.
(E) Representative image of H&E staining of tibialis anterior (TA) muscle of 12-month-old WT 4F mice following muscle injury by CTX injection. Scale bar, 50 μm.
(F) Immunostaining of Laminin in muscle sections of 12-month-old WT 4F mice.
(G) Quantification of fiber cross-sectional area frequency distribution and percentage of central nucleated fibers in muscle sections of 12-month-old WT 4F mice following muscle injury by CTX injection (−Dox n = 4; +Dox n = 4). **p < 0.001 according to two-tailed Student’s t test.
(H) Immunostaining and quantification Pax7-positive cells in muscle sections of 12-month-old WT 4F mice following muscle injury by CTX injection (−Dox n = 4; +Dox n = 4). *p < 0.05 according to two-tailed Student’s t test.
Data are presented as mean ± SEM. See also Figure S7.

