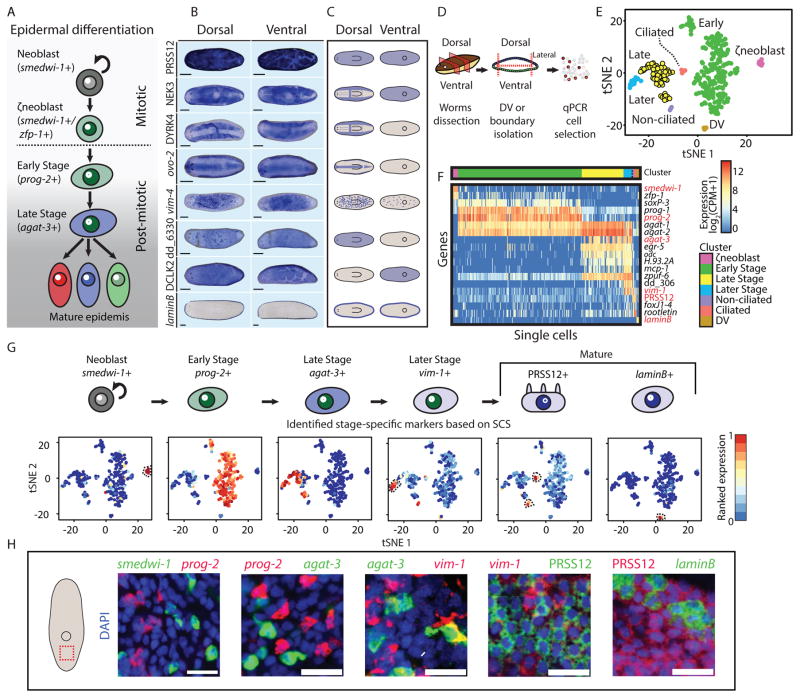
Figure 1. Mature epidermal identities revealed by RNA-seq.
(A) A model for planarian epidermal maturation. Epidermal progenitors have spatiotemporally distinct stages (Eisenhoffer et al., 2008; Tu et al., 2015). Stage-specific gene expression markers distinguish different maturation stages. Epidermal progenitors generate multiple epidermal cell types characterized by different spatial distribution and gene expression. (B) Different epidermal gene expression patterns were detected by WISH. Shown are eight representative expression patterns (blue) in dorsal (left column) and ventral (right column) views. As animals are semitransparent, following bleaching (Pearson et al., 2009), assessing domains of expression requires examination from multiple viewpoints (scale bar = 100 μm). (C) Cartoon of the expression patterns reported in Fig 1B. Blue color represents region of epidermal expression. (D) Analysis of the epidermal lineage by SCS. Isolation of epidermal progenitors; pre-pharyngeal fragments were dissected to isolate dorsal, ventral, or lateral fragments, separately (STAR Methods). Tissues were disassociated and individual cells were sorted to plates by FACS. agat-1 expression (Eisenhoffer et al., 2008) was measured by qPCR and cells expressing agat-1 were sequenced and used for analysis, in combination with previously published SCS of the epidermal lineage (Wurtzel et al., 2015). (E) t-distributed stochastic neighbor embedding (tSNE) representation of epidermal cells (dots) is shown (STAR Methods). Colors represent different clusters, with labels for cluster identities based on gene expression markers for epidermal maturation stages (Tu et al., 2015). (F) Gene expression in single cells (columns) of previously described epidermal genes (rows). Gene expression is represented by color (blue to red, low to high expression; counts per million, CPM; Hierarchal clustering was used to order cells within a cluster). Red labels denote genes that were subsequently used for FISH experiments, because of their power to discriminate between clusters, and their low background expression in FISH (Table S3). (G) Upper panel: Cluster-specific gene expression markers that were used for evaluating the distribution of epidermal lineage progenitors in situ. Markers were selected based on their fold-enrichment and power to discriminate between clusters. Lower panel: tSNE plot of cells (dots) colored by the ranked expression of the gene markers we selected across all sequenced cells (blue to red, low to high gene expression, respectively; dotted black line highlights cell clusters). (H) The selected gene expression markers were assessed by co-expression FISH analysis (scale bar = 20 μm). The markers had a nearly complete lack of co-expression, therefore permitting the analysis of distinct maturation stages.

