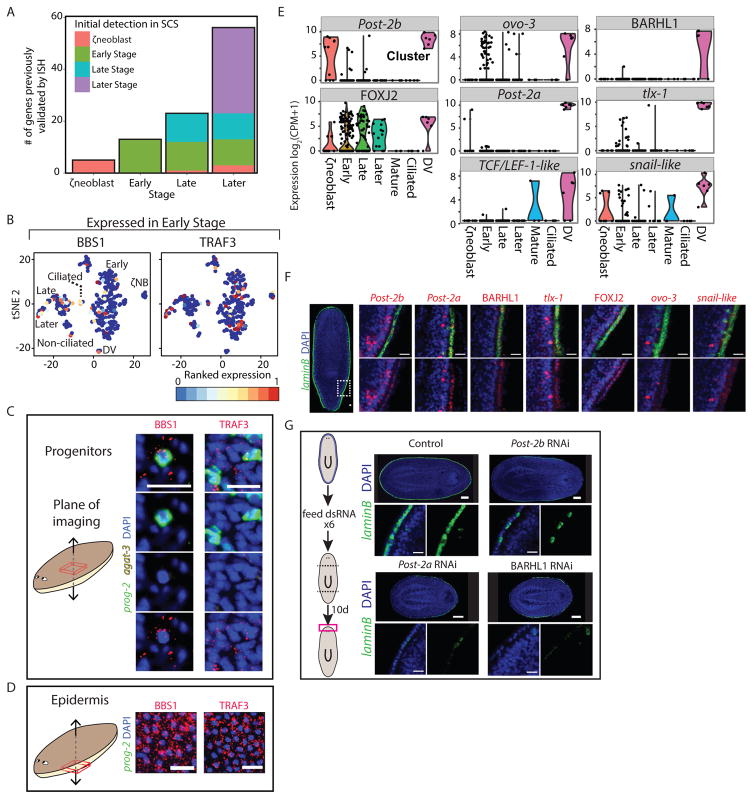
Figure 2. Mature epidermal gene expression is abundant in epidermal progenitors.
(A) Expression of validated epidermal genes in SCS data across epidermal clusters. Shown are genes that were expressed only in the epidermal lineage. Color coding corresponds to the maturation stage in which the gene was initially expressed. (B) tSNE plots of two epidermal genes validated by WISH (BBS1 and TRAF3), that were found to be expressed in Early Stage progenitor cells (expression low to high, blue to red, respectively). (C–D) FISH validation of epidermal gene expression in Early Stage and Late Stage progenitors (C) and in mature epidermis (D), taken in different focal planes in the same animals (see schematic) by confocal microscopy (scale bar = 20 μm). White arrows indicate co-expression. Early Stage (prog-2) and Late Stage (agat-3) progenitor markers are not expressed in the mature epidermis. (E) Violin plots of the eight TFs that were enriched in the DV boundary epidermal cells are shown. Black dots represent expression of a single cell. (F) FISH validation of DV-boundary epidermis TFs, including co-expression with laminB. The expression of the TFs is shown in higher magnification at a DV region corresponding to the white-dashed box in the overview (left) image. See also Fig S3G. Scale bar = 20 μm. (G) Inhibition of three of the DV epidermal boundary TFs led to a reduction in DV epidermal boundary gene expression in regenerating animals 10 days following amputation, as observed by FISH for laminB expression. Top panels: The expression of laminB is greatly reduced in the perturbed animals. Scale bar = 100 μm. Bottom panels: Higher magnification of the DV boundary in the different RNAi conditions. Scale bar = 20 μm.

