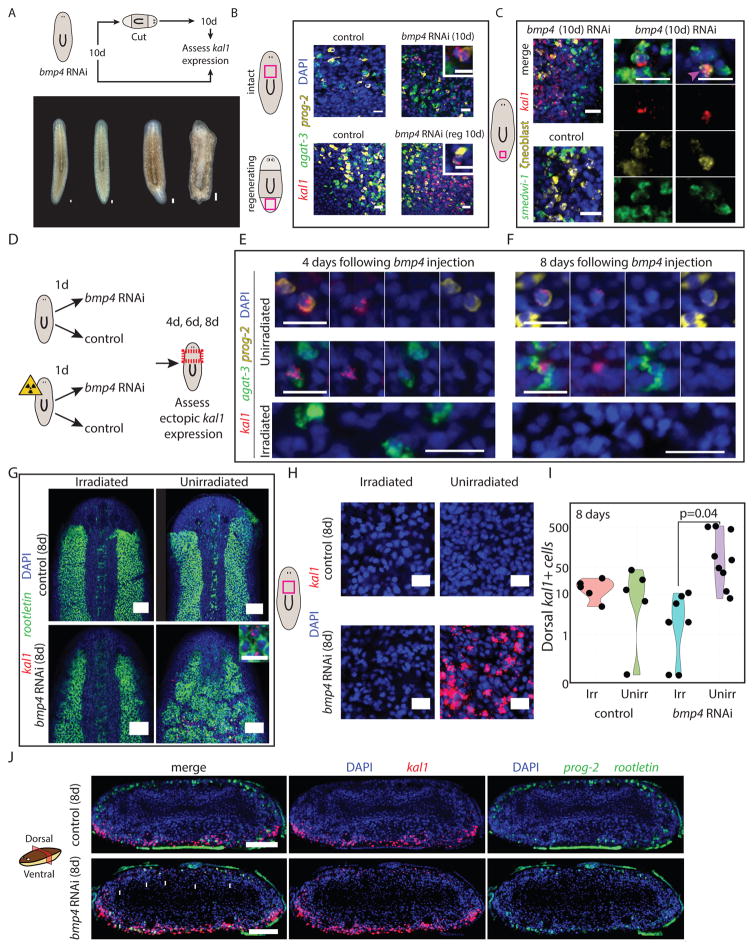
Figure 6. Planarian ζneoblast gene expression is regulated by extracellular positional signaling.
(A) bmp4 was inhibited by RNAi (STAR Methods), and 10 days following the first feeding of three, animals were either fixed or cut and allowed to regenerate for 10 days (upper panel). Animals did not have any visible defects prior to cutting (bottom panel), but following cutting and regeneration, they displayed major morphological defects, as previously reported (Molina et al., 2007; Reddien et al., 2007). (B) kal1 expression was observed 10 days following bmp4 RNAi on the dorsal surface, but never in control animals. Shown are animals before cutting (top) and animals at 10 day following regeneration (labeled reg 10d). Insets show a dorsal cell in bmp4 RNAi animal that co-expresses an Early Stage marker (prog-2) and kal1, demonstrating that reduction in BMP expression is sufficient for the appearance of ventral markers dorsally. Inset scale bar = 10 μm. (C) kal1 expression is observed in dorsal ζneoblasts, suggesting that ζneoblasts sense bmp4 expression in their environment and specify their positional gene expression accordingly. At day 10 following bmp4 inhibition animals displayed kal1 expression dorsally (left panel). Middle panel: In bmp4 RNAi animals, we detected dorsal kal1+ cells that also express smedwi-1 (a pan-neoblast marker), and ζneoblast markers (combination of soxP-3 and zfp-1, (van Wolfswinkel et al., 2014)), indicating that they were indeed epidermal neoblasts (white arrow). Right panel: In addition, we identified kal1+/ζneoblast+ cells that did not express smedwi-1, suggesting that they are more differentiated epidermal progenitors. Scale bar = 20 μm. (D) Animals were divided into two cohorts, one of which was lethally irradiated on day zero; the other was unperturbed. Half of the animals each cohort received a single injection of either bmp4 dsRNA or a control dsRNA. Animals were fixed and analyzed at day four, day six and day eight following injection. (E–F) At days four and eight following bmp4 dsRNA injections, epidermal progenitors on the dorsal side (prog-2+ or agat-3+ cells, top and middle panels, respectively), which expressed kal1, were detectable. Conversely, kal1+ dorsal epidermal progenitors were not detected in irradiated animals. At day eight following irradiation, epidermal progenitors are completely ablated. See also Fig S7A. Scale bar = 20 μm. (G) The dorsal expression of rootletin in the irradiated bmp4 animals is indistinguishable from control animals. Conversely, in three of eight unirradiated bmp4 RNAi animals, the dorsal rootletin expression resembled the ventral surface of the animal. See Fig S7B. Scale bar = 100 μm. Inset shows rootletin+ cells expressing kal1. Inset scale bar = 20 μm. (H) Expression of kal1 in dorsal pre-pharyngeal regions. Only unirradiated bmp4 RNAi had dorsal expression. Scale bar = 20 μm. (I) Quantification of the number of kal1+ cells on the pre-pharyngeal dorsal region of each animal (black dot) analyzed. Significance was assessed using Student’s t-test. Groups labeled Irr and Unirr represent irradiated and unirradiated groups, respectively. (J) Transverse section showing the spatial distribution of kal1+ cells in control and bmp4 RNAi animals. kal1+ cells were never found in the middle of the animal, despite ectopic expression in all bmp4 RNAi sections analyzed (white arrows). Scale bar = 100 μm.

