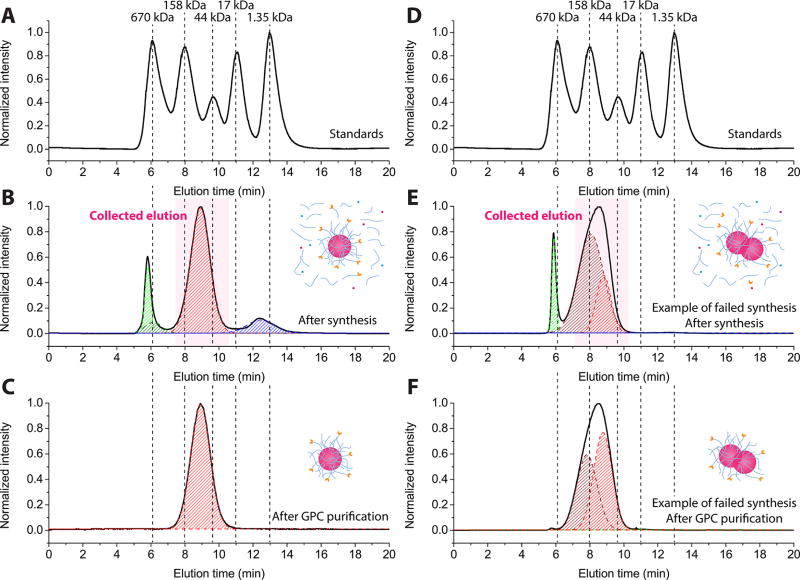
Figure 1.
GPC purification of cRGDY–PEG–Cy5–C′ dots. (A and D) GPC trace of five standard proteins with known molar mass. Representative GPC traces of cRGDY–PEG–Cy5–C′ dots before (B) and after (C) GPC purification. Examples of GPC traces of aggregated C′ dots before (E) and after (F) GPC purification. Different peaks in the GPC traces are fitted by Gaussian distributions and are colored in green (aggregates), red (C′ dots), and blue (unreacted reagents), respectively.

