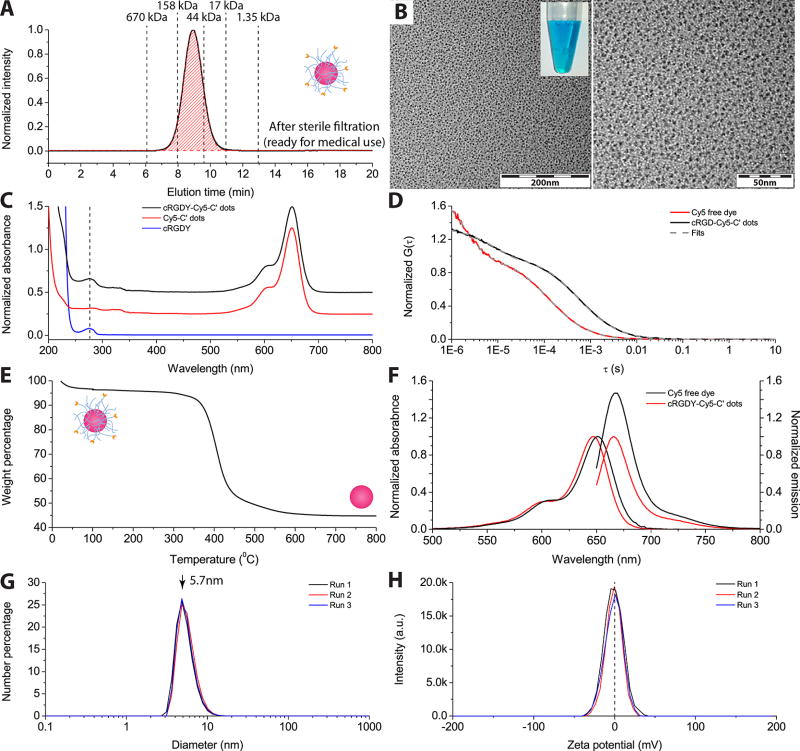
Figure 2.
Quality control measurements of C′ dot synthesis product. (A) GPC trace with 100% purity. (B) TEM images at different magnifications (inset shows optical appearance of Cy5 encapsulated C′ dots). (C) UV/vis absorption spectrum of cRDGY–Cy5–C′ dots compared to free cRGDY peptide and PEGylated Cy5–C′ dots without cRGDY ligands. (D) FCS autocorrelation curves for cRGDY–PEG–Cy5–C′ dots and Cy5 free dye. (E) TGA trace. (F) Absorbance and emission spectra of cRGDY–PEG–Cy5–C′ dots as compared to Cy5 free dye. (G) Superimposed DLS size measurements of three separate runs. (H) Superimposed ζ-potential measurements of three separate runs.

