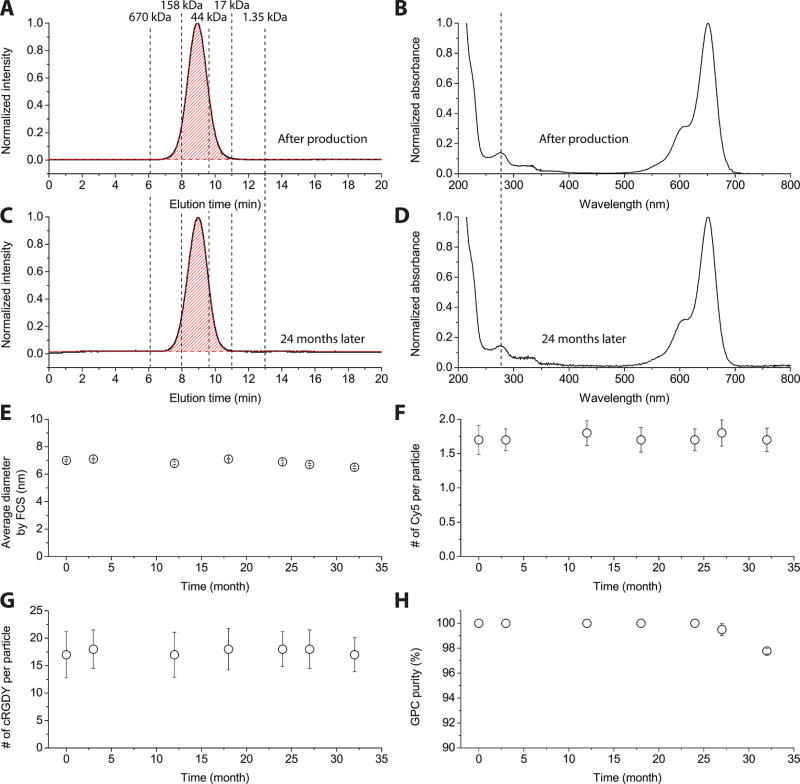
Figure 3.
Long-term stability assessment of cRGDY–PEG–Cy5–C′ dots. GPC trace (A) and UV/vis absorbance spectrum (B) of final cRGDY–PEG–Cy5–C′ dots right after particle manufacture. GPC trace (C) and UV/vis absorbance spectrum (D) of the same sample two years after particle manufacture. The C′ dots were stored at 4 °C in DI water at a concentration of 15 µM during the stability test. The GPC traces (A and C) were fit by Gaussian distributions (red) with fitted particle peak areas highlighted in red. FCS-derived particle size (E), FCS and absorbance-derived number of Cy5 dyes per particle (F), UV/vis absorbance-derived number of cRGDY ligands per particle (G), and GPC-derived purity (H) over more than 2.5 years after particle manufacture. See Supporting Information for details of the GPC analysis derived purity values.

