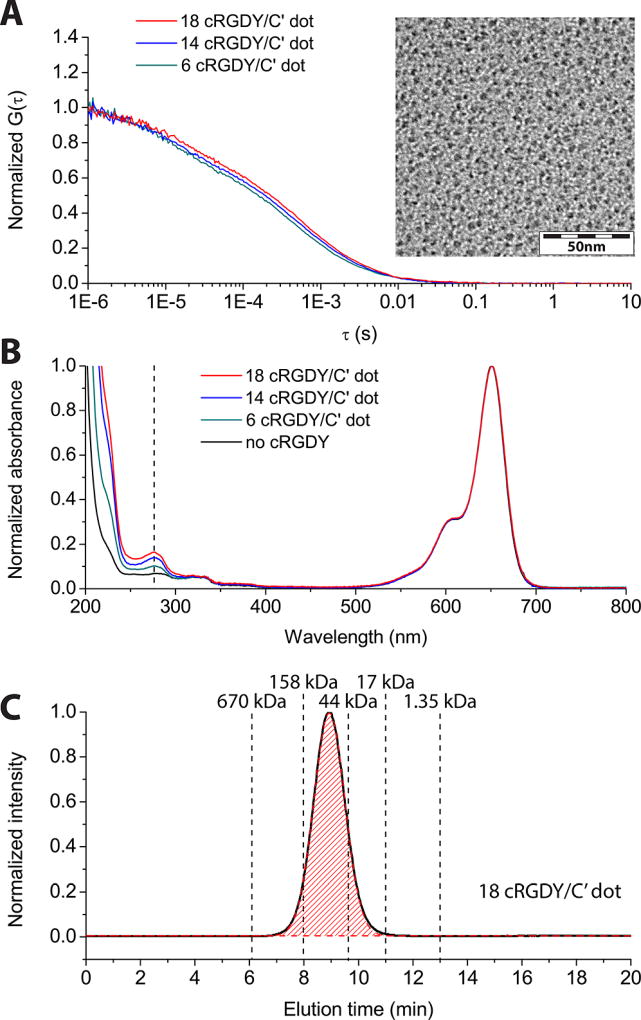
Figure 4.
cRGDY–PEG–Cy5–C′ dots with varying surface cRGDY ligand numbers. (A) FCS autocorrelation curves and (B) UV/vis absorbance of C′ dots with varying surface cRGDY ligand numbers as indicated. The insert in A shows a representative TEM image of cRGDY–PEG–Cy5–C′ dots, here with 18 cRGDY ligands per particle. In B, for comparison, a spectrum is shown for a nonfunctionalized PEGylated C′ dot. (C) Representative GPC trace of final products, shown here for C′ dots with 18 cRGDY ligands per particle. The full comparison of TEM and GPC traces of C′ dots with varying cRGDY ligand numbers are displayed in the Supporting Information.

