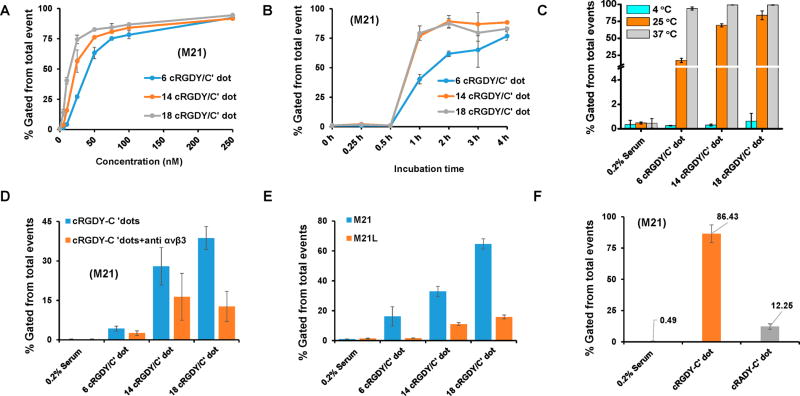
Figure 5.
In vitro integrin-targeted uptake of cRGDY–PEG–Cy5–C′ dots using a range of ligand numbers. Receptor-specific binding and cellular uptake of cRGDY–PEG–Cy5–C′ dots in αvβ3-positive M21 cells incubated in serum-deprived (0.2% FBS) media as a function of (A) particle concentration (0–250 nM) at 4 h postincubation, (B) incubation time (0–4 h) using 100 nM particle concentrations, and (C) incubation temperature (4–37 °C) by flow cytometry (100 nM, 4 h). (D) ανβ3 integrin receptor blocking of M21 cells using flow cytometry and excess anti–ανβ3 antibody prior to incubation with 25 nM cRGDY–PEG–Cy5–C′ dots. Anti-ανβ3 integrin receptor antibody concentrations were 100 times higher than particle concentrations (incubation time was 2 h). (E) Specific binding of 25 nM cRGDY–PEG–Cy5–C′ dots bearing a range of ligand numbers to serum-deprived M21 cells by flow cytometry (incubation time was 2 h) against M21-L cells lacking surface integrin expression (αvβ3-negative). (F) M21 cellular uptake of 25 nM cRGDY–PEG–Cy5–C′ dots (~14 cRGDY/C′ dot) in serum-deprived media relative to 25 nM cRADY–PEG–Cy5–C′ dots (~15–20 cRADY/C′ dot) by flow cytometry (incubation time was 2 h). Each bar represents mean ± SD of three replicates.

