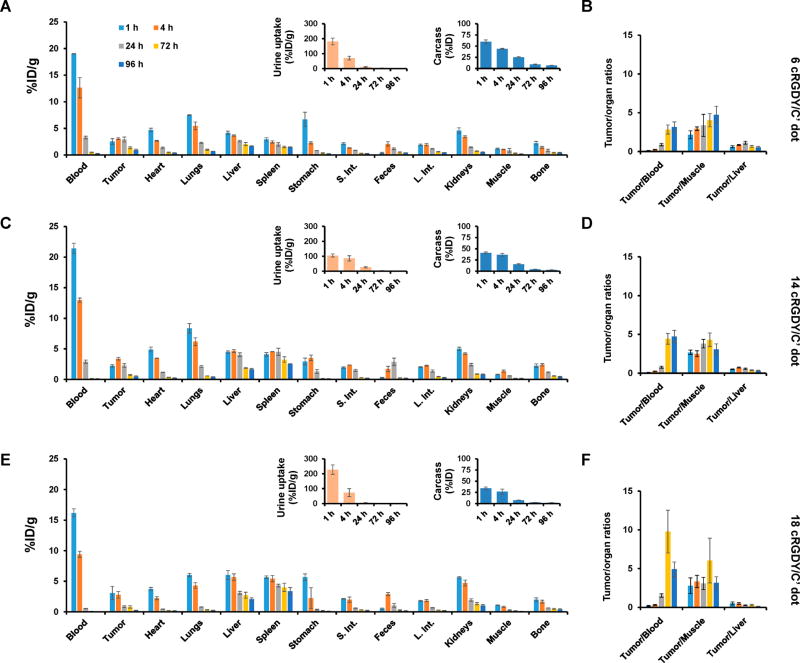
Figure 7.
Biodistribution studies in M21 tumor-bearing mice using cRGDY–PEG–Cy5–C′ dots of varying ligand number. Biodistribution patterns and tumor-to-background ratios observed in M21-xenografted mice following i.v.-injection of 131I–cRGDY–PEG–Cy5–C′ dots over a range of p.i. time points (i.e., 1–96 h) (n = 3): (A, and B) 6 cRGDY/C′ dot, (C and D) 14 cRGDY/C′ dot, and (E and F) 18 cRGDY/C′ dot. Insets in A, C, and E show corresponding urine uptake (presented as %ID/g) and retained activity in mice carcasses (presented as %ID) at different p.i. time points.

