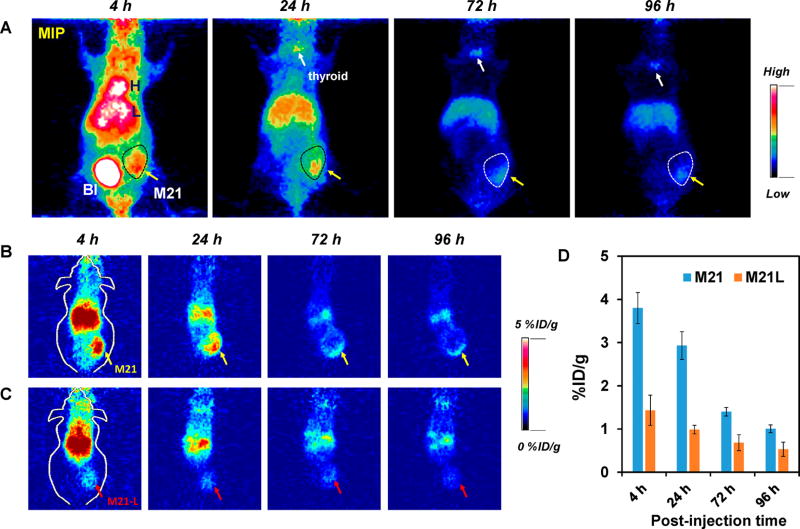
Figure 8.
In vivo tumor-targeted PET imaging studies. Time-dependent uptake of 124I–cRGDY–PEG–Cy5–C′ dots (18 cRGDY/C′ dot) in M21 (αvβ3 positive) and M21-L (αvβ3 negative) tumor-bearing mice (n = 3). (A) MIP images of M21 tumor-bearing mice systemically injected with 124I–cRGDY–PEG–Cy5–C′ dots. H: heart, L: liver, BI: bladder. M21 tumor marked with yellow arrows and thyroid gland marked with white arrows. Serial coronal tomographic PET images of 124I–cRGDY–PEG–Cy5–C′ dots in (B) M21 (yellow arrows) and (C) M21-L (red arrows) tumor-bearing mice. (D) Uptake of radiolabeled particles in M21 versus M21-L xenografts at different p.i. time points.

