
Fig. 1.
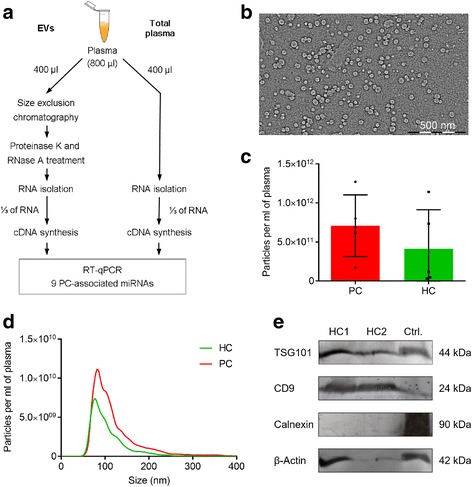
Workflow of the study and characterisation of plasma EVs. a Workflow of the study. b Representative transmission electron microscopy image of plasma EVs. c Quantification of EVs isolated from plasma of PC patients and healthy controls (HC) by nanoparticle tracking analysis. d Average size distribution of EVs isolated from plasma of PC patients and healthy controls. e Western blot analysis of EV markers (TSG101, CD9), endoplasmic reticulum protein Calnexin and β-actin in plasma EVs isolated from two healthy individuals and PC-3 cells (as a positive control)