
Fig. 3.
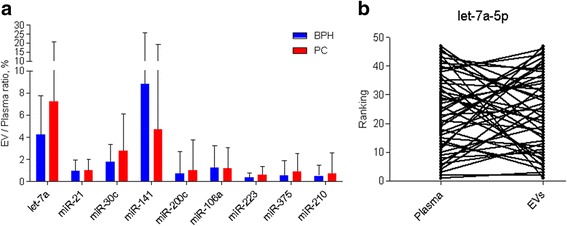
Relative abundance of EV-incorporated miRNAs. a Ratio between EV-incorporated and total cell-free miRNAs in whole plasma. Bars represent the mean ratios in groups of patients with PC and BPH. b A paired dot plot shows the ranking of PC patients according to Let-7a-5p levels in EVs and whole plasma; lines connect the samples from the same individual