
Fig. 5.
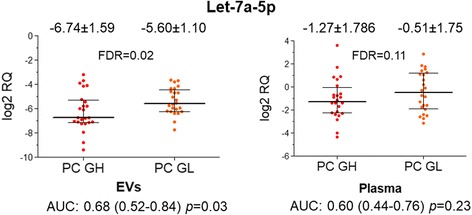
Circulating Let-7a-5p levels in PC patients with low and high Gleason score. Scatter plots show the log2RQ values of Let-7a-5p tested in EVs and in whole plasma of patients with Gleason score ≥ 8 (PC GH) and Gleason score ≤6 (PC GL). The mean log2RQ values and standard deviation is shown above each scatter plot. Area under the ROC curve (AUC), 95% confidence interval and p value for differentiating between PC patients with high and low Gleason score is shown below each graph