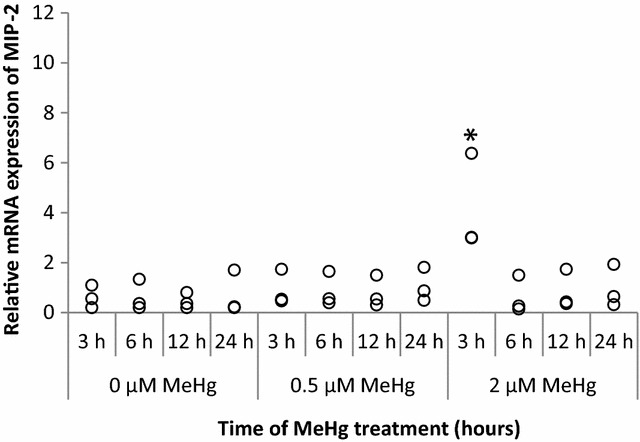
Fig. 2.

MIP-2 mRNA expression at 3, 6, 12, and 24 h after MeHg exposure. RAW264.7 cells were treated with 0 µM (control), 0.5, 2 µM of MeHg, and mRNA expression levels were analyzed by real-time PCR. Values were normalized to the expression of β-actin and it represents three independent experiments. MIP-2 mRNA expression induced by MeHg treatment alone is compared with control and the significant value is labelled as "*"
