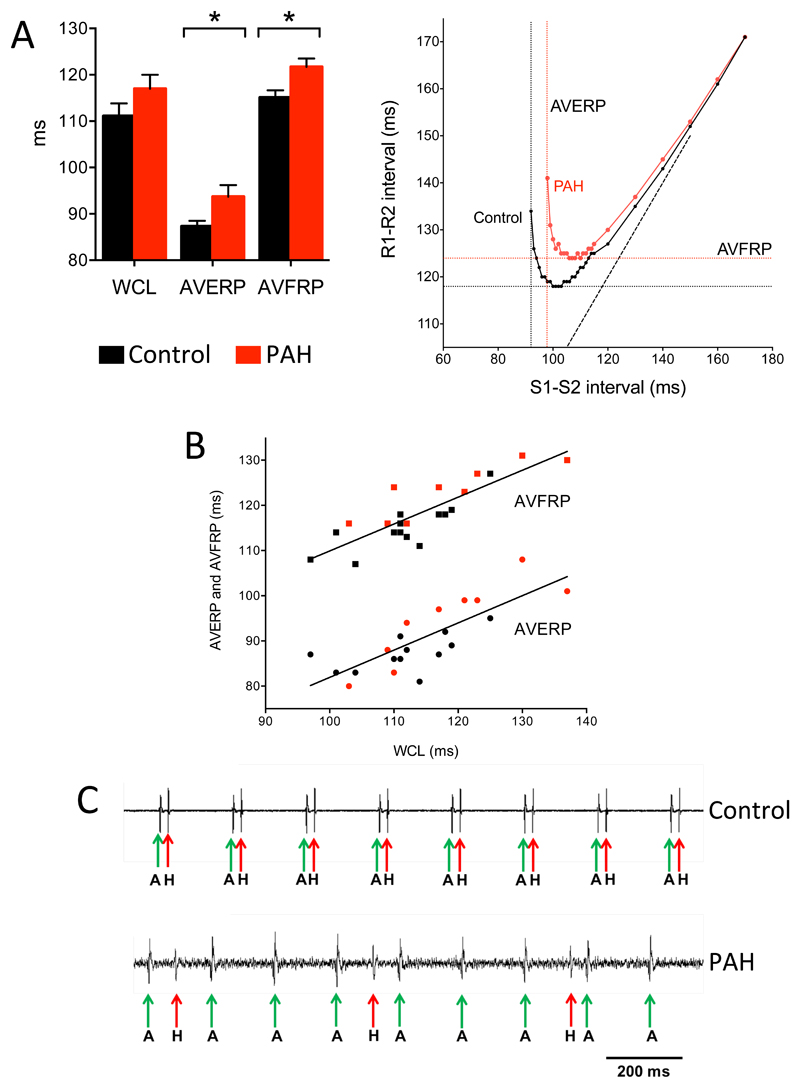
Fig. 2.
Impaired AV node conduction in PHT rats. All data collected on day of termination. A (left), mean (+SEM) Wenckebach cycle length (WCL), AVERP and AVFRP in control (black bars) and PHT (red bars) rats (n=10). Recordings made from Langendorff-perfused heart. *P<0.05 (Student’s t test). A (right), typical AV node conduction curves from control and PHT rats showing measurement of AVERP and AVFRP. B, significant correlation between AVERP and AVFRP and Wenckebach cycle length. Each point corresponds to different rat, control (black) or PHT (red). Data are fit by linear regression (AVERP, R2=0.63, P<0.001; AVFRP, R2=0.71, P<0.0001). C, demonstration of complete heart block in PHT rat. Extracellular potential recordings from region of His bundle of control (top trace) and PHT (bottom trace) rats shown. Recordings made from isolated AV node. Atrial (labelled A and marked with green arrow) as well as His bundle (labelled H and marked with red arrow) signals recorded.

