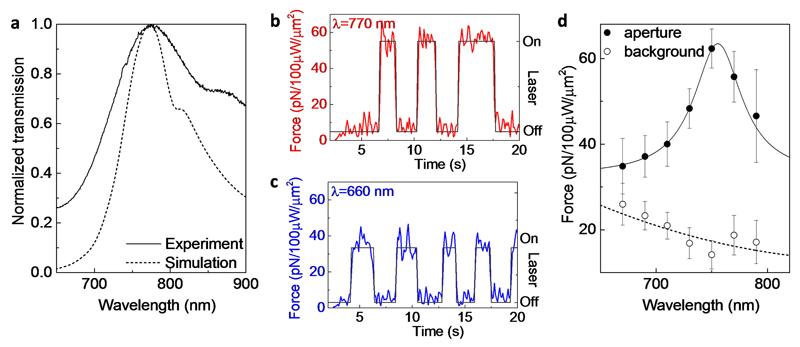
Figure 2. Spectroscopically measured optical forces with an achiral tip.
a, Normalized transmission spectra of the grating-flanked coaxial aperture shown in Figure 1b. The dotted curve is from numerical simulation (FDTD, Lumerical); the solid curve is from experimental measurement. The shoulder of the spectrum at longer wavelengths (~825-875 nm) comes from the converging beam interacting with the grating. The blue and red dashed lines highlight wavelengths of 660 nm and 770 nm, respectively. b, Measured optical force when the incident laser is at 770 nm, near the resonance of the coaxial aperture. The laser is manually toggled on and off (black line) to confirm the fidelity of the measurement. c, Measured optical force away from the coaxial resonance at 660 nm. d, Spectroscopic measurement of optical forces at the aperture and away from the aperture, where the on-aperture measurement follows the spectrum of the aperture. The error bars show standard deviations of measured forces at each wavelength. The solid and dashed curves are Lorentzian and polynomial fits, respectively.

