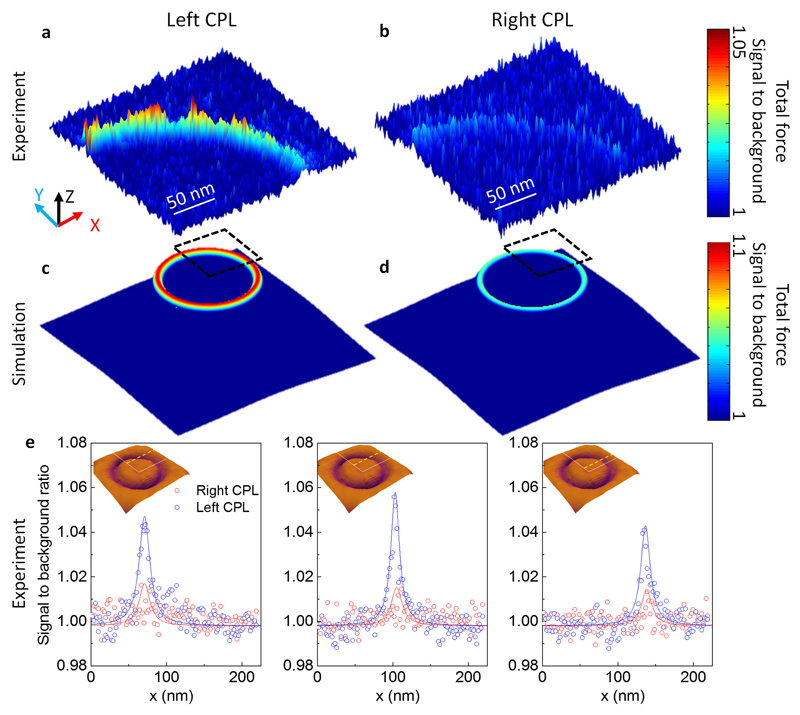
Figure 4. Enantioselective optical force map.
a, A quadrant of an experimental chiral force map on the coaxial nano-aperture with left-CPL illumination. b, Force map with the same chiral tip, but with right-CPL illumination. Both panels (a) and (b) are total forces normalized to the background signal, and plotted in linear scale with ranges indicated in the color bar to the right. c, Simulated optical forces with left-CPL and d, right-CPL illumination on the optical tweezer. The dashed square indicates the quadrant where the optical force map is experimentally measured. e, Normalized measured forces (signal-to-background ratio) in linear scale, along three horizontal locations across the coaxial aperture. The location of each line scan is indicated by the yellow dashed line in the inset, overlaid on the AFM topological map. The white lines in the inset indicate the quadrant of the coaxial aperture where the optical force maps are taken.

