Figure 1.

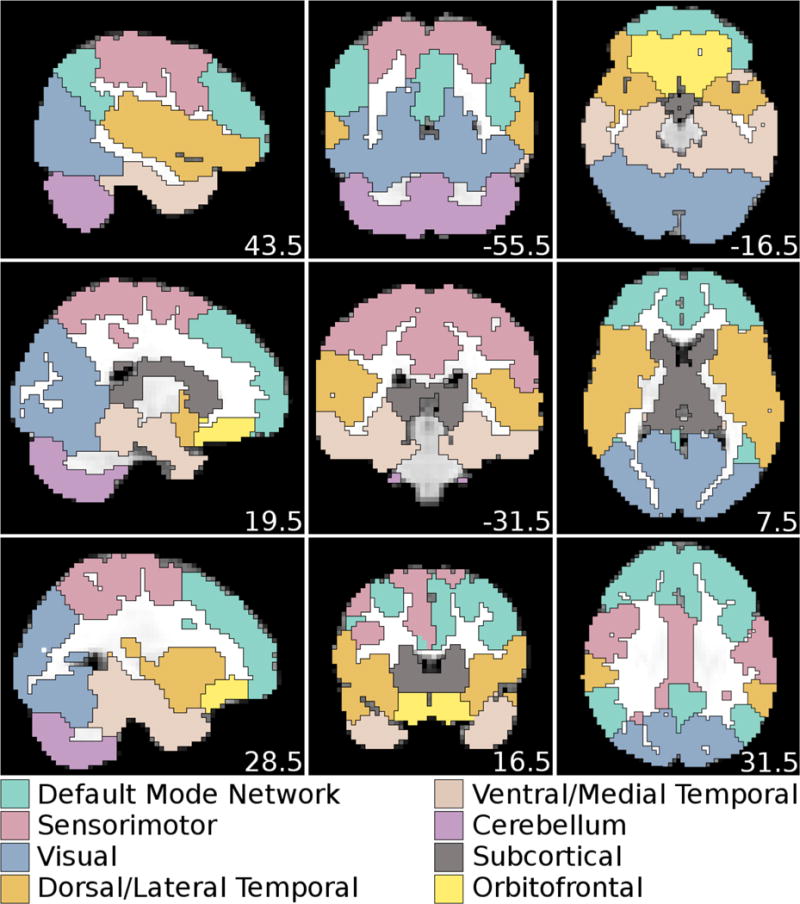
ROI network structure after running Infomap on the static FC graph of the 90th percentile of positive connections. Eight ROI subgraphs were detected by Infomap. Coordinates are in MNI space.

ROI network structure after running Infomap on the static FC graph of the 90th percentile of positive connections. Eight ROI subgraphs were detected by Infomap. Coordinates are in MNI space.