
Figure 2.
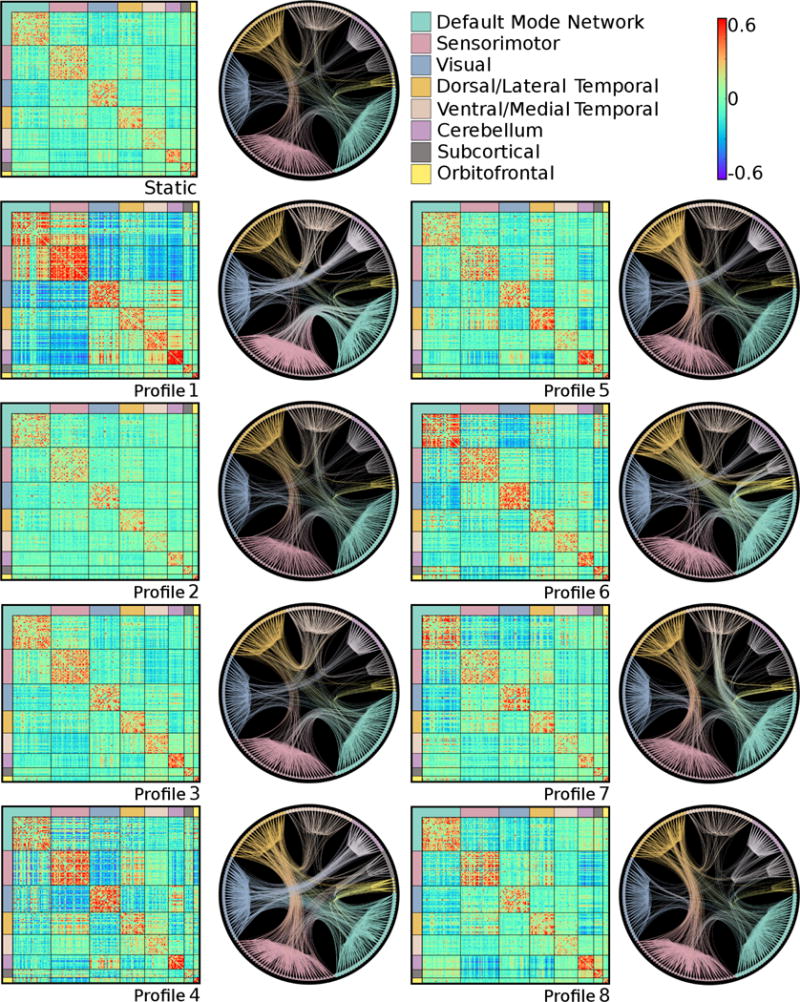
Functional connectivity for the static connectivity profile and each dynamic connectivity profile. Matrices represent average positive and negative connectivity between ROIs for all participants (static only) or average positive and negative connectivity between ROIs for all windows that correspond to a dynamic profile. Radial tree graphs represent the 90th percentile of positive connections.